HOT TOPICS LIST
- Strategies
- Stocks
- Buy
- Investing
- Brokers
- Psychology
- Interviews
- Accumulate
- Sell
- Hold
- Spotlight
- Websites
- Candlestick Corner
- Gold & Metals
- Options Trading
LIST OF TOPICS
THE CHARTIST
The Elliott Wave Vs. The Random Walk In The Battle Of The Century
10/02/03 08:04:34 AM PSTby Eric Morgan
The Elliott wave theory proves once again that the market is no random walk in the park.
| Every theory needs to be tested and challenged from time to time. One theory that garners a large following and has been considered established dogma for several decades is the random walk theory. To date, every challenge to it has been rebuffed, repelled, or repudiated. Many debunk it in private, but there has been no competing theory or methodology that has seriously challenged it. It's time for another challenge.
THE RANDOM WALK THEORYFirst, let's restate what the random walk theory is; according to InvestorWords.com, it is:
An investment theory which claims that market prices follow a random path up and down, without any influence by past price movements, making it impossible to predict with any accuracy which direction the market will move at any point. In other words, the theory claims that path a stock's price follows is a random walk that cannot be determined from historical price information, especially in the short-term. Investors who believe in the random walk theory feel that it is impossible to outperform the market without taking on additional risk, and believe that neither fundamental analysis nor technical analysis have any validity. However, some proponents of this theory do acknowledge that markets move gradually upward in the long run. In order to challenge the random walk theory, it would be nice if there were a competing theory that were its polar opposite — that is, a theory that identifies form, structure, and pattern in stock price movements. There is only one theory that does: Elliott wave. Unfortunately, this theory has a checkered reputation. A 2002 Barron's article on Robert Prechter, guru of Elliott wave theory, pointed out that most "mainstream market commentators and economists regard it at best as a meaningless projection of spurious patterns on random events and at worst as voodoo." But since this theory has an opposite viewpoint of hard financial reality, it might be instructive to pit one against the other over a dataset of sufficient length. The random walk's basic tenet is that price changes over one time period are uncorrelated with price changes over any previous time period. To successfully challenge the random walk, the Elliott wave theory must find price changes over time frames that are correlated with price changes over other time frames. Elliott waves must see some form of relatedness. That the market moves in waves is essential to understanding the nature of the market. The study of those waves was the basis for the development of the Elliott wave theory. For the Elliott wave theory to uncover relatedness between waves, it needs a completed structure; the longer the time frame, the better. It just so happens that a long-term Elliott wave structure just completed in January 2000 on the Dow Jones Industrial Average (DJIA), a structure encompassing 68 years of market data from the 1932 bottom to the 2000 top. That should be a sufficient dataset.
THE ELLIOTT WAVE THEORYIn Elliott wave theory, the market generally exhibits five-wave structures and three-wave structures. The market moves in five waves in the direction of the trend of one larger degree, and three waves counter to the trend of one larger degree. This has been established by studying decades of data of stock prices, commodity prices, and bond prices. It is an empirical observation that the market trends in five waves and three waves, regardless of the market you study. There are many levels or degrees of wave structures, where one five-wave structure is a simple wave of a much larger structure. These patterns build on one another to form long time frames, or can be broken down into much smaller time frames. The essential form and structure is maintained at any level of analysis. The degrees of wave structures from largest to smallest are: supercycle, cycle, primary, intermediate, minor, minute, and minuette. The degree of analysis for my purposes here is one of supercycle, cycle, and primary. The market advance from the 1932 bottom to the 2000 top constitutes a supercycle, composed of five waves of cycle degree. There are many guidelines and only two or three rules to help the Elliott wave analyst correctly count waves. The first rule is that wave 3 cannot be the shortest wave in the sequence. The second rule is that wave 4 cannot enter the price territory of wave 1. The wave structures analyzed in this article are of such large degree that there is little or no ambiguity in labeling the wave structures. Any Elliott wave analyst would count them in the same way.
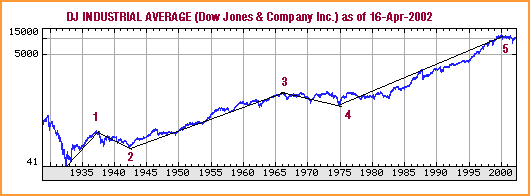
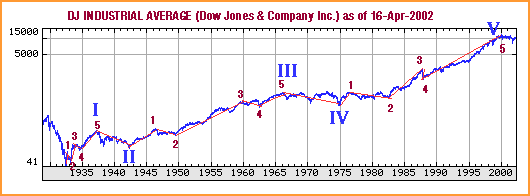
THE FIVE-WAVE SEQUENCEFigure 1 shows a completed five-wave structure of supercycle degree of the Dow Jones Industrial Average (DJIA), beginning at the 1932 bottom and ending at the January 2000 top. Superimposed on the chart are the five waves of cycle degree. To a random walk disciple, the graph is just a random jumble of peaks and troughs with an upward bias, while an Elliott wave analyst sees an obvious five-wave sequence. Waves 1, 3, and 5 advance in the direction of the trend of one larger degree. Wave 2 corrects the advance of wave 1, and wave 4 corrects the advance of wave 3. After wave 5, a correction occurs against the entire five-wave sequence. These waves of cycle degree subdivide into primary waves. Figure 2 shows how cycles I, III, and V subdivide into a five-wave structure of primary degree. Once again, the Elliott wave analyst can easily see five-wave structures at this level.
Figure 1: Wave structure. A completed five-wave structure of the supercycle degree of the DJIA. (Chart: Yahoo! Finance)
Figure 2: Subdivision of a five-wave structure. Here you see how cycles I, III, and V subdivide into a five-wave structure of primary degree. (Chart: Yahoo! Finance)
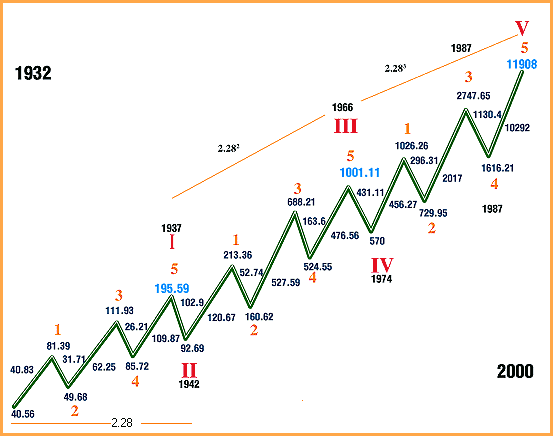
If each wave is idealized as a straight line, then Figure 3 shows the idealized supercycle subdivided into its cycle and primary wave structures. Each wave is labeled with the theoretical value of the DJIA at the beginning of the wave and at the end of the wave. The theoretical values of the DJIA are used because the actual print high and low of the DJIA weren't recorded until 1992. The theoretical high is the value of the DJIA if all 30 stocks hit their highs at the same time during the day. The theoretical low is the value of the DJIA if all 30 stocks hit their lows of the day at the same time. The length of each wave is also labeled.
Figure 3: Idealized supercycle. The supercycle is divided into its cycle and primary wave structures. ANALYZING THE WAVESLet's start the analysis. First, it is important to be aware of certain ratios that are prominent throughout the structure. The first ratio is the ratio of the length of the first two waves in the supercycle, primary wave 1, and primary wave 2 of cycle I. Primary wave 1 was 40.83 points, and primary wave 2 was 31.71 points: 40.83/31.71 = 1.288. The second ratio is the ratio between the length of primary wave 1 and primary wave 2 of cycle III. This ratio is 120.67/52.74 = 2.288. The third ratio is the ratio between the length of primary wave 1 and primary wave 2 of cycle V. This ratio is 456.26 / 296.31 = 1.54. In Figure 3, the ratio 2.28 is prominently displayed in three places. Its origin is as follows: If the cycle II low at 92.69 is divided by the start of the supercycle at 40.56, the result is 2.28. If the cycle III top at 1001.11 is divided by the cycle I top at 195.59, the result is 5.11 = 2.262, but would be 2.282 if the cycle I top was just three points less (192.59). If the cycle V top at 11908 is divided by the cycle III top at 1001.11, the result is 11.89 = 2.283. So the start or end of all of the waves of cycle degree except the cycle IV bottom relate to the ratio 2.28 or its powers. That alone shows the strong relationship of the major tops and bottoms in the DJIA all the way back to 1932.
THE FIRST WAVENow, let's analyze the first wave of each advancing cycle. Referring to Figure 3, primary wave 1 of cycle I divided by its starting point is 40.83 / 40.56 = 1.00. For cycle III, 120.67 / 92.69 = 1.30, which is very close to 1.28. For cycle V the result is 456.27 / 570 = 0.80, which is very close to 0.78, the inverse of 1.28. So wave 1 encompasses unity and 1.28 and its inverse, or nearly so with respect to the starting point of the wave. A close look at primary wave 3 and primary wave 5 in cycle I is in order next. Primary wave 3's length divided by the start of cycle I is 1.53 (62.25/40.56). Primary wave 5's length divided by the start of the cycle is 109.87/ 40.56 = 2.71 = 1.542.29. Doing the same for cycle V, the results are 2017/ 570 = 3.54 for primary wave 3. For primary wave 5, the result is 10292/570 = 18.06 = 3.542.29. These are astonishing results. What's more, 3.54/1.54 = 2.29. Primary waves 3 and 5 in cycle I and cycle V relate to each other in an identical manner. The exponents are identical, 1 for wave 3 and 2.29 for wave 5. The base for each is related by the factor 2.29. Isn't that mathematically elegant? These waves relate to each other perfectly. The results are summarized in Figure 4.
Figure 4: Wave relationship. Note that the different waves relate to each other in each cycle. These results are incompatible with the random walk theory, where relationships between waves are coincidental or nonexistent. That waves are connected over time is obvious from this result. That the DJIA market action from 1974 to 2000 (cycle V's time span) was precisely related to the meandering of the DJIA back in 1932 to 1937 (cycle I's time span) is remarkable. Imagine a little 62-point rally in 1933 is precisely related to a gargantuan 10,292-point rally from 1987 to the 2000 top. Let's examine cycle III's results. Primary wave 3's result is 527.59/92.69 = 5.69 = 3.541.38, where 1.38 = 1.291.29. Primary wave 5's result is 476.56/92.69 = 5.14 = 3.541.29. Cycles I, III, and V all relate to each other simply by dividing the length of primary waves 3 and 5 by the starting point of their respective cycle. Strike one against the random walk! Now let's compare the length of the primary waves of cycles I, III, and V. Let's begin with cycle V versus cycle III. The length of primary wave 1 of cycle V is 456.26 points. The length of primary wave 1 of cycle III is 120.67 points: 456.26 / 120.67 = 3.78 or very close to 3.82. Now divide primary wave 3 of cycle V by primary wave 3 of cycle III. The result is 2017 / 527.59 = 3.82. Now divide the length of primary wave 5 of cycle V by the length of primary wave 5 of cycle III. The result is 10292 / 476.56 = 21.59 = 3.822.29. To a random-walk disciple, this is a surprising result. The advancing waves of cycle V relate to their counterparts in cycle III by the same factor 3.82. Strike two! What is so special about 3.82? Its relationship to the Fibonacci series: 3.82 = 2.291.618. That exponent, 1.618, is the Fibonacci ratio. In addition, 2.29 = 1.618 * square root of 2. 3.82 = 2.29 * 1.292 = 1.618 * 1.542. Need more proof the market isn't random? Here it is: Compare the length of the primary waves of cycles V versus cycle I. Primary wave 1's result is 456.26 / 40.83 = 11.17. Primary wave 3's result is 2017 / 62.25 = 32.40. Primary wave 5's result is 10292 / 109.87 = 93.67. Dividing 32.40 / 11.17 = 2.90. Dividing 93.67 / 32.40 = 2.89 — another remarkable result. These waves relate to each other by the same factor, 2.90, which equals 2.29 * 1.27. Strike three! The random walk just struck out. You can't find chaos in these numbers. The results are summarized in Figure 5.
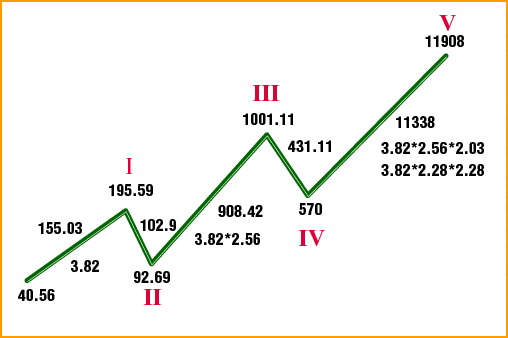
Figure 5: Summary of wave relationships. Waves 1, 3, and 5 are related to each other by the same factor in each cycle. If the distance between the top of wave 5 and the bottom of wave 2 for each advancing cycle is computed and divided by the bottom of wave 2, then the results are (195.59 - 49.68) / 49.68 = 2.93 for cycle 1, (1001 - 160.62) / 160.62 = 5.23 for cycle III, and (11908 - 730) / 730 = 15.31 for cycle V. Putting cycle III and V in terms of cycle I reveals that 5.23 = 2.931.54 for cycle III and 15.31 = 2.932.54 for cycle V. Also note that 2.93 = 2.28 * 1.28, 5.23 = 2.282, and 15.31 = 2.282 * 2.93. Cycle V's result is equal to the product of cycle III and cycle I. This was designed into the structure. Since there is a clear relationship between waves of primary degree, let's move up one level and see if there is relatedness between the waves of cycle degree. Since this is the first supercycle that we can study precisely because we have recorded data on it, we can only study the internal relationships between the waves of cycle degree. We can't study waves of cycle degree across other supercycles. This limits our ability to study large-scale relationships. Figure 6 shows the five-wave structure of cycle degree composing the larger supercycle. Cycle I gained 155 points (195.59 - 40.56). Cycle III gained 908 points (1001 - 92.69), and cycle V gained 11338 points (11908 - 570). Let's define the concept of a wavelength as the length of a wave divided by its starting point. The wavelength for cycle I was 3.82 (155 / 40.56). In addition, 3.82 = 2.29 * 1.292 and 3.82 = 2.291.618. The wavelength for cycle III was 9.80 (908.42 / 92.69), which equals 3.82 * 2.56, or 3.82 * 1.602. Cycle V's wavelength was 19.89 (11338 / 570), which equals 3.82 * 2.56 * 2.03 or 3.82 * 2.282.
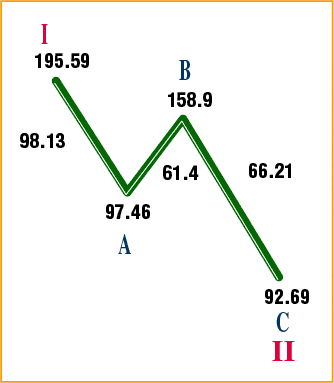
Figure 6: Five-wave structure of the super-cycle Note that cycle III and cycle V are expressed in terms of the wavelength of cycle I. Cycle III's wavelength was 2.56 times larger than cycle I's. This also occurred in the subdivided wave one degree below cycle III. Primary wave 1's wavelength was 1.30 (120.67 / 92.69), very close to 1.288 (see Figure 3). Primary wave 3's wavelength was 3.285 (527.59/160.62), and 3.285/1.30 = 2.53, very close to 2.56. So the same wavelength ratio was at work at two different degrees. Cycle V's wavelength expressed in terms of cycle III's wavelength is 3.82 * 2.56 * 2.03. Cycle V, then, was slightly more than twice the wavelength of cycle III. It was also 2.282 times larger than cycle I. Remember how almost all of the cycle tops and bottoms of the supercycle structure were related by the ratio 2.28 or a power thereof? Here, cycle V is related to cycle I by the same ratio. Expressed as a function of 2.29, the wavelength of cycles I, III, and V are 2.291.618 (3.82), 2.292.76 (9.79), and 2.293.608 (19.89). The relationship between the exponents is revealed by dividing the exponent of cycle V by the exponent of cycle III. The result is 1.30 (3.608 / 2.76). If cycle III's exponent is divided by cycle I's exponent, the result is 1.70 (2.76 / 1.618), but 1.70 is nothing but 1.302. Therefore, at cycle degree, the advancing waves are related to each other through 2.29, and 1.30 and its square — and of course, 1.30 is very close to our famous 1.29 number. The wavelength of cycle III is 1.602 times the wavelength of cycle I. The wavelength of cycle V is 2.029 times the wavelength of cycle III. But 2.029 = 1.60 * square root of 1.60 = 1.603/2 = 1.60 * 1.27. So the wavelength of cycles I, III, and V are related to each other through the number 1.60, which is almost the Fibonacci ratio. The number 1.60 was first seen in the supercycle structure at the start of primary wave 3 of cycle III, a third of a third, where the start of the primary wave was at 160.62 points, which was 100 * 1.60. I don't think that was a coincidence. Cycle I's wavelength expressed in relation to 2*pi, or 6.28, is 3.82/6.28 = 0.61 (inverse of 1.618). Cycle III's relationship is 9.8/6.28 = 1.56, or pi / 2, and cycle V's relationship is 19.89/6.28 = 3.16, which is slightly greater than pi. As stated earlier, cycle III's wavelength was 2.56 times larger than cycle I. Cycle V's wavelength was 2.02 times larger than cycle III. What's the relationship between these two numbers? Well, 2.56 / 2.02 = 1.27. If the advance of cycle III (908.42 points) is divided by cycle II's decline of 102.9 points (195.59 - 92.69), the result is 8.82 = 2.972 = 2.292 * 1.292; 3.82, the wavelength of cycle I is 1.29 * 2.96. 8.82 / 3.82 = 2.30, nearly 2.29. If the advance of cycle V (11338 points) is divided by cycle IV's decline of 431 points (1001.11 - 570), the result is 26.29. 26.29 = 2.973 = 2.293 * 1.293. Remarkably, these two numbers are embedded throughout a wave structure that lasted 68 years. Here is an interesting aside. The first wave of the advance that began in 1932 was an exact double (81.39 / 40.56 = 2.00). Figure 7 shows the three-wave structure of cycle II's decline. Note the A wave, the first wave of cycle II, was a linear halving (195.59 / 97.46 = 2.00). The first wave in cycle I was a linear doubling, while the first wave of cycle II was a linear halving.
Figure 7: Three-wave structure of cycle II's decline
The start of the supercycle began at 40.56. Well, the log of 40.56 = 1.608. The log of 1616.21, the crash low of 1987, and the beginning of the primary wave 5 advance of cycle V is 3.208; 3.208 / 1.608 = 1.995 or almost exactly 2. The first wave of the supercycle was a linear doubling. A logarithmic doubling encompassed all the waves up to the beginning of the last wave, the fifth of a fifth. Very impressive. In addition, 3.208 - 1.608 = 1.6. The first primary wave of the supercycle started at 1.60 (logarithmically speaking). The last primary wave of the supercycle started a logarithmic distance of 1.60 away from the start of the supercycle. Do you see the symmetry? Coincidentally, the last wave, if you are keeping score in natural logarithms, is a distance of 2 as well: ln 11908 - ln 1616 = 1.997 (deuces at the beginning, and deuces at the end). Finally, Robert Prechter identified the 1929 top as the top of supercycle III, and the beginning of supercycle IV. The DJIA at that top was 386.1. At the end of supercycle IV and the beginning of supercycle V, the one we are analyzing, the DJIA was at 40.56. What is the relationship between 40.56 and 386.1? Well, 40.56log 40.56 = 385.46, close to 386.1. Another way of expressing it, the log of 40.56 = 1.608, and 1.6082 = 2.586. The antilog of 2.586 = 385.46. Just food for thought. Relationships between waves abound, inside and outside of the supercycle structure. We've just touched on some of them. Obviously, you can't take a random walk in the market, not if that market is the Dow Jones Industrial Average.
CONCLUSIONThese calculations prove that the market, at least the DJIA over the 68-year history and its post-Depression bull market, is not randomly making tops and bottoms in its march toward destiny. The market has a memory. It knows where it's been and it knows where it's going. The Elliott wave structure is unfolding as it was planned. The economist Adam Smith wrote about the invisible hand that guides the economy and the marketplace. Well, he didn't know the half of it. That hand is directing the twists and turns of the DJIA with a precision that is utterly astonishing. James Burke, who developed and narrated a television series in the 1980s called Connections on PBS, found connections between disparate historical events that when carefully analyzed were the causal factors in the way subsequent events played out. Here, we empirically observed waves that occurred in decades past and see how they influence waves occurring today. Robert Prechter saved the Elliott wave theory from the dustbin of history. Perhaps there is a different theory that should be reserved for the dustbin. I guess Wall Street was wrong again.
Eric Morgan can be reached at kiss716@yahoo.com.
Current and past articles from Working Money, The Investors' Magazine, can be found at Working-Money.com.
|
| E-mail address: | morganed@nswc.navy.mil |
PRINT THIS ARTICLE

|

Request Information From Our Sponsors
- StockCharts.com, Inc.
- Candle Patterns
- Candlestick Charting Explained
- Intermarket Technical Analysis
- John Murphy on Chart Analysis
- John Murphy's Chart Pattern Recognition
- John Murphy's Market Message
- MurphyExplainsMarketAnalysis-Intermarket Analysis
- MurphyExplainsMarketAnalysis-Visual Analysis
- StockCharts.com
- Technical Analysis of the Financial Markets
- The Visual Investor
- VectorVest, Inc.
- Executive Premier Workshop
- One-Day Options Course
- OptionsPro
- Retirement Income Workshop
- Sure-Fire Trading Systems (VectorVest, Inc.)
- Trading as a Business Workshop
- VectorVest 7 EOD
- VectorVest 7 RealTime/IntraDay
- VectorVest AutoTester
- VectorVest Educational Services
- VectorVest OnLine
- VectorVest Options Analyzer
- VectorVest ProGraphics v6.0
- VectorVest ProTrader 7
- VectorVest RealTime Derby Tool
- VectorVest Simulator
- VectorVest Variator
- VectorVest Watchdog

