HOT TOPICS LIST
- Strategies
- Stocks
- Buy
- Investing
- Brokers
- Psychology
- Interviews
- Accumulate
- Sell
- Hold
- Spotlight
- Websites
- Candlestick Corner
- Gold & Metals
- Options Trading
LIST OF TOPICS
MUTUAL FUNDS
Defining Growth Funds
03/01/01 04:08:40 PM PSTby Han Kim
Growth funds used to be the high-flying act among mutual funds, but why have they fallen of late?
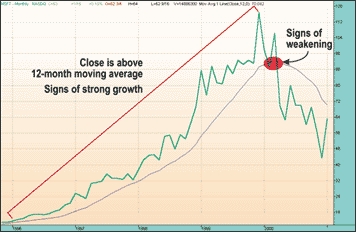
| What's in a name? What does it mean to be a growth fund? To paraphrase the Bard of Avon, like a rose, that which we call a growth fund/by any other name would smell as sweet. The philosophy behind growth funds is to achieve long-term capital growth by investing primarily in stocks that exhibit a greater-than-average rate of growth. The stocks behind these companies are expected to continue to show a high level of growth. There are various types of growth funds such as large caps and small caps. If the investment objective of the fund is based along these lines, then the fund is a growth fund, no matter what its name. Fund managers look at several variables to determine whether a stock should be considered to be a growth stock. Most of the analysis is quantitative, although some may be considered qualitative. In general, growth fund portfolios contain stocks that fund managers believe will outperform others within similar sectors as well as the rest of the market. WHAT ARE GROWTH FUNDS, ANYWAY? Morningstar, Inc., defines growth funds as mutual funds with the objective of achieving capital appreciation by investing in growth stocks. A growth stock is defined as one in which the earnings and/or revenue are growing faster than its industry or the overall market. If that's the case, then, at least in a bull market, growth funds should perform better than the overall market. The key to their performance lies in the selection of stocks, which is the responsibility of the fund manager. Each fund manager will utilize unique analytic processes, which they will incorporate to find the correct mix of stocks to create their mutual fund. Though managers' analytic processes have their personal quirks, most growth fund managers look for some common key characteristics when it comes to selecting companies. These include: 1 Historical growth ratesAlthough the past growth rate may not accurately reflect the future growth of a company, it is still widely used to predict the company's future performance. Nobody can predict the future, but based on firm-specific information, macroeconomic conditions, and performance of competing firms, analysts can make some type of judgment on the firm's growth prospects. Future growth of a company can also be measured by fundamental criteria such as price/earnings ratios (P/E), return on equity (ROE), reinvestments, and retention rates, to name a few. One of the more popular methods of measuring earnings growth among analysts is the price/earnings (P/E) ratio. The P/E ratio is calculated by dividing the security's current stock price by the earnings per share (EPS) of the previous four quarters. Generally, a stock with a high potential for growth will have a higher P/E ratio because, simply put, when there is the increased likelihood of growth opportunities, the company's stock price will be high relative to earnings. The idea is that as earnings increase, the value of the company will also increase, which in turn should be reflected in the increased appreciation of the stock price. The P/E ratio shows how much an investor must risk to gain $1 of the company's earnings per year. Here's an example of how to calculate P/E ratio using Microsoft Corp. (MSFT) as an example. As of January 17, 2001, the current stock price was $53 and the total earnings per share for the past year was $1.76. The P/E ratio is equal to $53 divided by $1.76, which is approximately 30 (53/1.76 = 30.1). This value is the P/E multiple and indicates the firm's growth opportunities. Merely looking at the company's P/E ratio is not enough. You must compare it with others to get an idea of how much more growth potential the company has over similar products. A common approach is to compare the P/E ratio of companies within the same industry. Those with faster earnings growth are probably the ones with the greatest growth potential. However, a high P/E ratio does not mean that the company is guaranteed to experience growth. "The company is way overvalued, considering they have no earnings!" was a common phrase during the dotcom craze prior to the tech correction of the spring of 2000. Strong and consistent growth forms the essence of a company's ability to succeed. Suppose a company has a P/E ratio that suggests strong growth but for some reason experiences inconsistencies in its growth. The company may no longer be contributory to the objectives of the fund. At that point, the manager must decide whether to keep the company in the fund. Since there will be several companies that exhibit strong and consistent growth, it is in the managers' best interest to select the cream of the crop. They do so by comparing growth rates with others in the same industry. All else being equal, those with the strongest accelerated growth rates are better. Even then, there may still be too many candidates; managers will cross-check the remaining companies with fast-growing sectors. The theory is that a fast-growing company in a fast-growing sector should yield the best results. Sometimes, however, poor management thwarts that idea. Therefore, growth fund managers will favor strong management over any or all of the previously mentioned characteristics. Some managers even include technical analysis as an added tool in their decision-making process. The techniques used by managers to select stocks differentiate one fund from another. Many of these company characteristics are judgment calls made by the fund managers. AFTER THE FACTS Now that you know what growth funds are, why haven't they come out smelling like roses? Growth funds are made up of stocks that are targeted to move in a positive direction. Unfortunately, all of the stocks can't sustain the positive growth rate every year. The situation is similar to a stock that has shown strong performance but reaches a point where it can't sustain that rate of growth, which then leads to periodic price corrections. In Figure 1, you can see that this happened to Microsoft (MSFT).
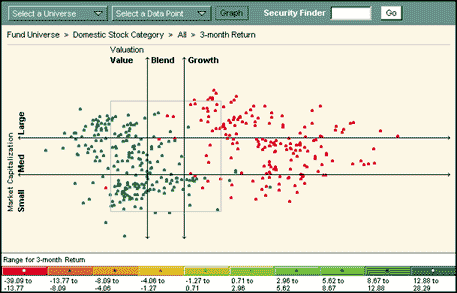
You should invest in growth funds with the intention of holding them for the long term. Figure 2 shows how growth funds tracked by Morningstar, Inc., have fared in the last three months. Take a look at the best- and worst-performing funds. You can see that growth funds did not perform well during this short time frame.
What it boils down to is that growth funds in general are equivalent to the high-flying trapeze act in a circus. If you get the high-risk maneuvers right with good timing and teamwork, the show is spectacular, but if things go wrong, it's a fast and scary fall. But have no fear; provided you have a net, those who fall can get right back up again, smelling like a rose. Han Kim can be reached at HKim@Traders.com. |
Staff Writer
| Title: | Webmaster |
| Company: | Technical Analysis, Inc. |
| Address: | 4757 California AVE SW |
| Seattle, WA 98116 | |
| Phone # for sales: | 206-938-0570 |
| Fax: | 206-938-1307 |
| Website: | working-money.com |
| E-mail address: | hkim@traders.com |
Traders' Resource Links | |
| Charting the Stock Market: The Wyckoff Method -- Books | |
| Working-Money.com -- Online Trading Services | |
| Traders.com Advantage -- Online Trading Services | |
| Technical Analysis of Stocks & Commodities -- Publications and Newsletters | |
| Working Money, at Working-Money.com -- Publications and Newsletters | |
| Traders.com Advantage -- Publications and Newsletters | |
| Professional Traders Starter Kit -- Software | |
PRINT THIS ARTICLE

Request Information From Our Sponsors
- StockCharts.com, Inc.
- Candle Patterns
- Candlestick Charting Explained
- Intermarket Technical Analysis
- John Murphy on Chart Analysis
- John Murphy's Chart Pattern Recognition
- John Murphy's Market Message
- MurphyExplainsMarketAnalysis-Intermarket Analysis
- MurphyExplainsMarketAnalysis-Visual Analysis
- StockCharts.com
- Technical Analysis of the Financial Markets
- The Visual Investor
- VectorVest, Inc.
- Executive Premier Workshop
- One-Day Options Course
- OptionsPro
- Retirement Income Workshop
- Sure-Fire Trading Systems (VectorVest, Inc.)
- Trading as a Business Workshop
- VectorVest 7 EOD
- VectorVest 7 RealTime/IntraDay
- VectorVest AutoTester
- VectorVest Educational Services
- VectorVest OnLine
- VectorVest Options Analyzer
- VectorVest ProGraphics v6.0
- VectorVest ProTrader 7
- VectorVest RealTime Derby Tool
- VectorVest Simulator
- VectorVest Variator
- VectorVest Watchdog


