HOT TOPICS LIST
- Strategies
- Stocks
- Buy
- Investing
- Brokers
- Psychology
- Interviews
- Accumulate
- Sell
- Hold
- Spotlight
- Websites
- Candlestick Corner
- Gold & Metals
- Options Trading
LIST OF TOPICS
INVESTING
Which Way Will The Market Go?
03/01/01 04:42:59 PM PSTby Dennis D. Peterson
If you've ever looked at a stock price chart, you know that prices can move erratically. Take advantage of oscillators to determine the momentum of this price change. Knowing when to use them and which ones to use is critical.
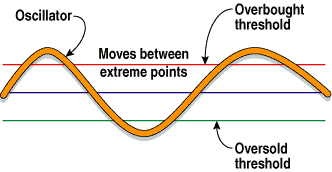
| Investors and traders use oscillators to judge the momentum of a market or stock. Oscillators, as the name implies, go up and down -- they oscillate. Interpreting an oscillator's movements always goes back to understanding how a market or stock behaves, behavior that is usually calculated using simple formulas. Looking at an oscillator to interpret what a stock or market will do next is sometimes like looking at a mood ring whose color is supposed to tell you the mood of the wearer. Your prediction of what the stock or market will do next will be more accurate if you understand the mood or the momentum of what an oscillator is measuring. Given the right circumstances, an oscillator can be powerful predictors of events. THE BASIS FOR MOMENTUM Oscillators are built around the notion of comparing past values to present ones for a given period. They can be as simple as comparing yesterday's price to today's and noting the change between them. Over time, this change forms the basis for momentum. Oscillators typically have upper and lower limits. You can use those limits as overbought (too expensive) or oversold (too cheap) thresholds. They are applicable to stocks, sectors, or market indexes. Figure 1 shows the general movement and idealized behavior of an oscillator.
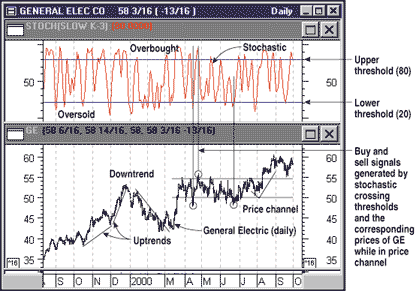
The same is true when it comes to selling. At the highest price, sellers sense an urgency to absorb all the profit they can. As the price gets lower, the urgency to sell lessens. The rate of change is strong in the beginning and then peaks. This buying/selling mood is what gives an oscillator its characteristic shape. Do all stocks oscillate? At some point, they usually do. Some may seem to be going up or down all the time. The ideal oscillator candidate is a stock or sector moving between two extremes; the stock moves sideways, moving up and down in a price channel. This gives you an opportunity to buy a stock or invest in a sector when it is oversold, or sell when it is overbought. As an example, let's use the stochastic oscillator (upper chart, Figure 2). This oscillator is available at most Internet sites that provide charting. You can see from Figure 2 that the stochastic does go up and down; the threshold values of 80 and 20 are the accepted standard. How can an oscillator move between the same extremes when the General Electric price (bottom chart) is so different at times?
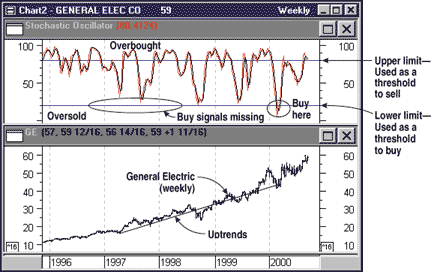
The answer? The stochastic oscillator is measuring the relative price performance and the rate of change of that performance. The stochastic measures today's price level relative to the price range of several days ago. It then determines whether the most recent price activity is moving up or down relative to its past performance. But Figure 3 doesn't show the stochastic as crossing the oversold threshold! Where are the buy signals? Shown is GE's performance on a weekly basis, whereas Figure 2 displayed a daily chart. At times, there will be enough up-and-down movement to show effective signals, but Figure 3 shows that in a trend you may find that an oscillator will not cross a threshold and therefore oscillation is not effective.
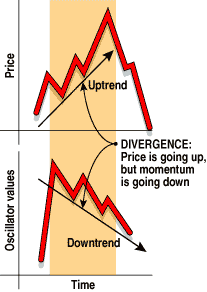
Besides indicating when an oversold or overbought condition exists, oscillators also provide insight into a divergence. As you can infer from the name, a divergence occurs when two conditions move in opposite directions. In this case, the opposite actions are the directions of the oscillator and price trends. Figure 4 depicts this scenario.
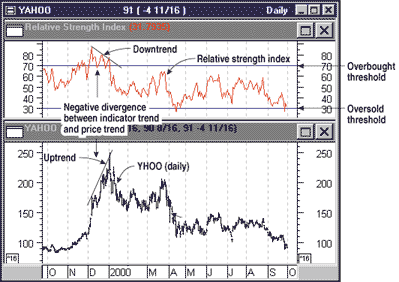
The key to using an oscillator is using the right one(s) at the right time, since each provides a slightly different type of analysis. The stochastic measures strength relative to the price range of several days ago. If a stock or sector continues to go up above the top of its price range, it tends to "bump its head" on the upper limit. When a stock or market is in a strong uptrend, you need an oscillator that measures its current strength relative to the past. Another popular oscillator, the relative strength index (RSI), on the other hand, uses the average price at the market close and divides average price closes that are up by those that are down. This ratio will help determine if price on average is moving up faster than it is moving down. The chart of Yahoo! (YHOO) in Figure 5 shows prices going up in December and RSI momentum going down. In this situation, divergence has occurred because price and momentum are moving in opposite directions. Remember that oscillators reflect behavior, so what happened here is that RSI hit a peak earlier than prices did and started to decline before prices did. As a consequence, each attempt to move up has less oomph -- less momentum -- hence creating the downtrend.
Oscillators are independent of the stock or sector; the exceptions are oscillators specifically designed to look at an entire market. Because oscillators measure momentum, they can tell us if something is overbought or oversold; they can tell us if there is a divergence between price and momentum trends; they can even tell us the mood of buyers and sellers. Finally, using the correct oscillator at the right time can increase the accuracy of your analysis, and choosing the right oscillator at the right time can be accomplished if you understand what an oscillator is measuring. Dennis Peterson can be reached at DPeterson@Traders.com. |
Market index trading on a daily basis.
| Title: | Staff Writer |
| Company: | Technical Analysis, Inc. |
| Address: | 4757 California Ave SW |
| Seattle, WA 98116-4499 | |
| Phone # for sales: | 206 938 0570 |
| Fax: | 206 938 1307 |
| Website: | working-money.com |
| E-mail address: | dpeterson@traders.com |
Traders' Resource Links | |
| Charting the Stock Market: The Wyckoff Method -- Books | |
| Working-Money.com -- Online Trading Services | |
| Traders.com Advantage -- Online Trading Services | |
| Technical Analysis of Stocks & Commodities -- Publications and Newsletters | |
| Working Money, at Working-Money.com -- Publications and Newsletters | |
| Traders.com Advantage -- Publications and Newsletters | |
| Professional Traders Starter Kit -- Software | |
PRINT THIS ARTICLE

Request Information From Our Sponsors
- StockCharts.com, Inc.
- Candle Patterns
- Candlestick Charting Explained
- Intermarket Technical Analysis
- John Murphy on Chart Analysis
- John Murphy's Chart Pattern Recognition
- John Murphy's Market Message
- MurphyExplainsMarketAnalysis-Intermarket Analysis
- MurphyExplainsMarketAnalysis-Visual Analysis
- StockCharts.com
- Technical Analysis of the Financial Markets
- The Visual Investor
- VectorVest, Inc.
- Executive Premier Workshop
- One-Day Options Course
- OptionsPro
- Retirement Income Workshop
- Sure-Fire Trading Systems (VectorVest, Inc.)
- Trading as a Business Workshop
- VectorVest 7 EOD
- VectorVest 7 RealTime/IntraDay
- VectorVest AutoTester
- VectorVest Educational Services
- VectorVest OnLine
- VectorVest Options Analyzer
- VectorVest ProGraphics v6.0
- VectorVest ProTrader 7
- VectorVest RealTime Derby Tool
- VectorVest Simulator
- VectorVest Variator
- VectorVest Watchdog

