HOT TOPICS LIST
- Strategies
- Stocks
- Buy
- Investing
- Brokers
- Psychology
- Interviews
- Accumulate
- Sell
- Hold
- Spotlight
- Websites
- Candlestick Corner
- Gold & Metals
- Options Trading
LIST OF TOPICS
INVESTING
Getting Started With Options
03/26/01 11:33:33 PM PSTby Joe Demkovich and Eugene Theriot
Rather than shying away from the complexity of options, stick with some simple basics in exploiting them.
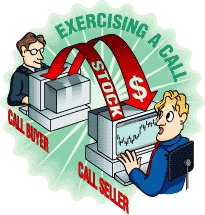
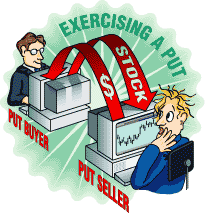
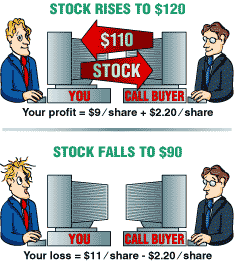
| You can start paper-trading options despite their daunting reputation for complexity. If you succeed on paper, you'll have taken the first step to extracting profits from the real market. It's true that there are many kinds of options, and options terminology is like a foreign language, but professional traders use options for a good reason. We'll tell you why. But first, yes, you can lose 100% of your investment. Of course, it is theoretically possible to do this by buying a stock, but it just doesn't happen. Even if you make an incredibly poor choice of equities, you (usually) won't lose all the value in the next month or two. But it is all too easy to buy an option one week that will be worthless the next. However, options can also be conservative, especially when used in conjunction with equities that you already own. MYRIAD OPTIONS Many combinations of options go by special names, but basically, there are only two types: puts and calls. Calls are contracts to buy a fixed number of shares of a specified equity (for our purposes, we will use stocks) for a fixed price on or before a fixed date (Figure 1), while puts are contracts to sell a fixed number of shares of a specified equity for a fixed price on or before a fixed date. To exercise an option is the process by which the holder of an option makes or receives delivery of shares of the security. (See Figures 2 and 3.) The fixed price may be above or below the current market price and is referred to as the strike price. The fixed date is the expiration date and is the third Friday of the month.
If you own a May 120 call on a given stock, you have the right to buy 100 shares of that stock at $120 on or before the third Friday of May. If the current price of that stock is a lot higher than 120, the option will be worth a lot of money. If this is the case, you don't have to exercise the contract (and buy the shares); you could just sell the call contract. Conversely, if the current price is a lot lower than 120, the option will be worth very little. You could sell the option to claim the small value, or you could hold it to expiration and let it expire, worthless. To complicate matters, you could be long or short the option. If you start out buying a call, then you are long the call. You "bought to open" your position. Then, if you sell the same option (instead of exercising it), you "sell to close" your position. If you started out selling the option, then you are short the contract; you "sold to open" your position. You then "buy to close" if you want to close out your position.
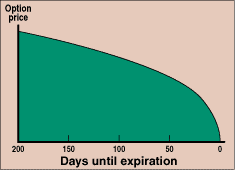
The investor who is long the contract is referred to as the holder and that person is the only one to decide if the contract is to be exercised. The person who sold the contract to the holder is known as the writer of the contract, and that person is obligated to fulfill the terms of the contract if the holder decides to exercise it. ON OPTIONS TERMINOLOGY We have already covered most of the special terms: call, put, strike, expiration date, holder, writer, buy, sell, long, short. There are only a few others you need to know to get started. But first, let's review what you do know. If you are long a call, you hold it, and you have the right to buy 100 shares at a fixed price on or before a fixed date. You can remember that the call gives you the right to call a stock away from the writer of the option. Conversely, if you are long a put, you hold the put and you have the right to sell 100 shares at a fixed price on or before a fixed date to the writer of the put. As a simple mnemonic, you can remember that the put gives you the right to put it to the writer by making him buy the stock from you. The terms holder and writer are used to distinguish who is long and who is short the option. If you hold the option, you bought the contract, and you have the right to decide if the contract is to be exercised. If you hold the option, you don't have to exercise to get your value out; you can sell the contract if it has a value, or you could let it expire if it doesn't (Figure 4).
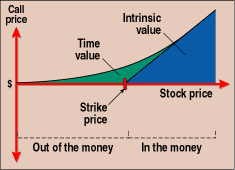
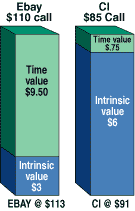
These three terms describe the relationship between the strike price and the equity price (Figure 5). If they are the same, the option is said to be at-the money. If you hold a call and could get the stock cheap by exercising the call because the strike price you'd pay is much lower than the equity price, the option is in-the-money. You won't want to exercise an option that is out-of-the-money because it would be cheaper to buy or sell the equity in the market. However, an out-of-the-money option may have a substantial time value that could be realized by selling the option.
OPTION VALUE A pricing model known as the Black-Scholes model is commonly used to compute the fair price of an option. This model takes into consideration the price of the equity, its volatility, the strike price, and other factors. The formula is complex, but the two major underlying concepts are not.

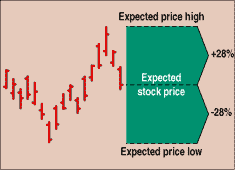
VOLATILITY Volatility is a measure of how much a stock's price typically changes over a period (Figure 8). It is usually expressed as a percentage number without the percent sign. For example, a stock may have a volatility of 28. This means that the annual variation in stock price is expected to be within 28% of the current price with a probability of about 2/3 (one standard deviation). Subtracting 2/3 chance from one leaves a probability of about 1/6 that the price will be more than 1.28 times today's price and 1/6 that it will be less than 1/1.28 times today's price.
In addition to computed historical volatility, you will hear of implied volatility. Since the time-value portion of an option price is related to the stock volatility in the pricing model, you could take an actual option price and then work backward to see what volatility is implied by the option's open-outcry price. If this number is higher than the stock's computed volatility, the option is said to be expensive. Stock volatility tends to vary around a long-term average number known as the historical volatility. Unlike prices, which could continue to go up, volatility tends to revert to the long-term average for a stock. OPTIONS SYMBOLS The options symbols are more complex than you might think at first. You must remember that you can't or at least shouldn't construct the option symbol; instead, you should look it up. In addition, if you use the symbol for trading (instead of referring to "January 250 call"), you must check that you are trading what you expect to be trading. Most software these days handles the symbol generation for you, but it never hurts to double-check. See sidebar, "Options symbols." EXPIRATION MONTH As we've mentioned before, options expire on the third Friday of the month. If a stock is optionable, there will be options available that expire in the current month and the next month and a month further out. After this month's expiration, additional options will become available, but there will always be a near-term option and a longer-term option available. The only difference between long-term equity anticipation securities (LEAPS), which are long-term listed options, with maturities that can be as long as two and a half years, and other options is that LEAPS are generally available for expiration in January of next year and the year after that. EXPERIENCE IS EXPENSIVE It will cost you some time to learn about options, but it need not cost much money. There are good but expensive programs available that will help you to screen stocks to find suitable candidates and then screen options and suggest any of a dozen or more option strategies designed to take advantage of circumstances. However, free or inexpensive information is available on the Internet. Go to www.cboe.com/toolbox and download the Options toolbox that teaches about options. On a day-to-day basis, www.BigCharts.com has both symbols and list of options available. Go to www.myTrack.com and download (for free) a program that will provide you a large amount of useful information on stocks and options (also free). Not only that, on a given equity, you can get quotes, trade volume, price volatility, news, charts, and learn which options are available. Then for each option, you can get quotes, symbols, and trade volume. The myTrack program also allows you to define a portfolio so you can papertrade options. Go to www.theonlineinvestor.com and learn of pending stock splits, brokerage up- and downgrades, and stock-buyback plans. These will help you pick stocks for option consideration. GETTING STARTED You've done the homework, so now let's look at a simple example. Suppose you own a stock that is now selling for 101 and it has a volatility of 35. To earn additional money on your position, you want to sell (that is, take in cash) a covered call (that is, you have the stock to deliver if the call is exercised) against your stock about two strike prices above the current price about two months out. An options calculator shows you that in the 52 days to expiration, there is a 25% probability that the option will be in-the-money and that the price of the option should now be about $2.64 if we are buying it or $2.16 if we are selling. Further, the broker tells you that the option is actually trading for $2.20, making the implied volatility 33.5. The option is a little cheap to buy and slightly bad news if you are selling. The $2.20 that you can get for the option looks pretty good. The probability isn't high that the option will expire in-the-money and have the stock taken away. Even if it does, you will get $110 for the stock plus the $2.20 for the option. And if the option expires worthless, you can do this again in two months. Meanwhile, if the stock tanks in the next two months, you're partly protected. You'll still suffer the loss from the $101 level, but it will be reduced by the $2.20 (less commissions) you got from selling the call. If it doesn't go below $101 - $2.20 = $98.80, you're still ahead of the game (Figure 9).
FIGURE 9: OPTION ACTIVITY. Here's how an option is traded. There! You've traded an option and it hardly hurt. The simple expedient of selling someone else the right to own your stock at $9 over its current price as a way to improve overall return is probably the most accessible way of using options to your advantage. Still think options are for the pros? Well, that's true. Are they for you as well?
Joe Demkovich and Gene Theriot are partners in a business of options investing. They can be reached via E-mail at joeandgene@att.net or on the Internet at http://JoeAndGene.home.att.net. Option analysis tools are available for download from their website. This article was originally published in Technical Analysis of STOCKS & COMMODITIES in October 1999. Copyright © 2001 Technical Analysis, Inc. All rights reserved. | ||||||||||||||||||||||||||||||||||||||||||||||
| Address: | Undisclosed |
| Albuquerque, NM 87123 | |
| Phone # for sales: | 505 294 5964 |
| Website: | JoeAndGene.home.att.net |
| E-mail address: | joeandgene@att.net |
PRINT THIS ARTICLE

Request Information From Our Sponsors
- StockCharts.com, Inc.
- Candle Patterns
- Candlestick Charting Explained
- Intermarket Technical Analysis
- John Murphy on Chart Analysis
- John Murphy's Chart Pattern Recognition
- John Murphy's Market Message
- MurphyExplainsMarketAnalysis-Intermarket Analysis
- MurphyExplainsMarketAnalysis-Visual Analysis
- StockCharts.com
- Technical Analysis of the Financial Markets
- The Visual Investor
- VectorVest, Inc.
- Executive Premier Workshop
- One-Day Options Course
- OptionsPro
- Retirement Income Workshop
- Sure-Fire Trading Systems (VectorVest, Inc.)
- Trading as a Business Workshop
- VectorVest 7 EOD
- VectorVest 7 RealTime/IntraDay
- VectorVest AutoTester
- VectorVest Educational Services
- VectorVest OnLine
- VectorVest Options Analyzer
- VectorVest ProGraphics v6.0
- VectorVest ProTrader 7
- VectorVest RealTime Derby Tool
- VectorVest Simulator
- VectorVest Variator
- VectorVest Watchdog


