HOT TOPICS LIST
- Strategies
- Stocks
- Buy
- Investing
- Brokers
- Psychology
- Interviews
- Accumulate
- Sell
- Hold
- Spotlight
- Websites
- Candlestick Corner
- Gold & Metals
- Options Trading
LIST OF TOPICS
MUTUAL FUNDS
Long Term Returns: What's Realistic And What's Not?
04/30/01 05:29:01 PM PSTby Bruce R. Faber
Is a 10% annual return possible year after year? Maybe not every year. Definitely not every fund. But you'll be surprised at what you can get.
| Saving for retirement: It's not easy, but it's got to be done. In my articles, I have tried to present the benefits that come for those who save some of their income now in order to enjoy a greater income later. A cornerstone - if not the entire foundation! - of my crusade for the savings grail has been that dollars saved in an individual retirement account (IRA), which grows - untaxed - at a 10% annualized return, can provide incredible rewards for your retirement years. (Subscribers who may have missed my earlier work on this subject can catch up by searching for Faber on the Working Money website: http://premium.working-money.com/wm/archive.asp.) And from what I've gathered from the letters received in the Working Money offices, my expressed viewpoint has been solidly supported. There has been a detractor or two, to be sure. One of the most vehement was from a reader who took issue with my using a constant return of 10% per year as an example. His complaint was that the market fluctuated wildly and that real-world percentages should be used instead of the hypothetical constant of 10% a year. The market does fluctuate, and sharply, I must agree; the sad truth is that sometimes the market does crash, and when it does, it takes all of the averages down with it. The letter-writer went on to compare some real-world figures against the constant I had used. At the end of a 20-year comparison of $10 investments, the real-world returns came to just under $60, while the constant 10% return was just over $67. Interestingly, his calculations began in a year with a 15% negative real-world return. If he had started his calculations just one year later, his total would have been considerably higher than the constant!
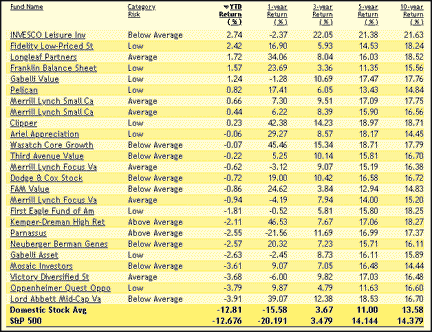
FIGURE 1: The Fund Selector tool on Morningstar.com produces lists of funds
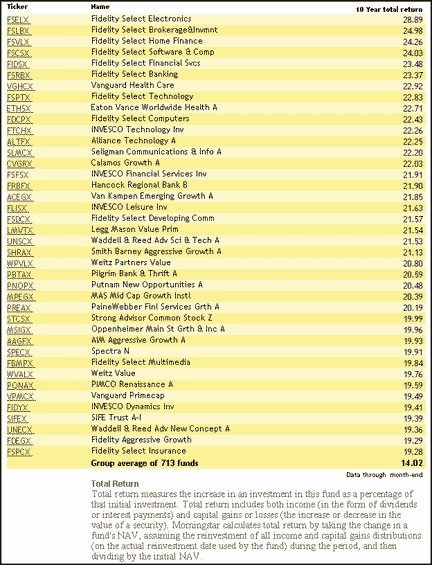
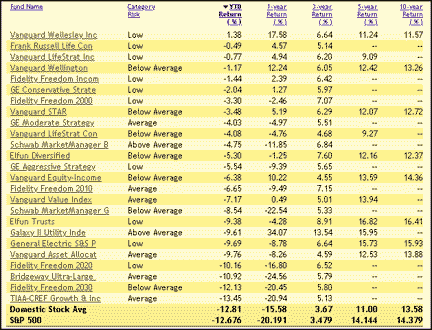
His point was well taken, however. How difficult is it to get an average return of 10% on your investments? What I discovered, with just a little surfing around the web, surprised me. Some of the short-term returns (10%) I found were phenomenal, but even the long-term returns of some mutual funds have been far greater than 10%. (See Figure 1.) GETTING YOUR 10% One of the first things that became apparent during my research was that mutual fund evaluations, whether you get them through a brokerage or a search engine, are often based on information from Morningstar, Inc., a leading provider of mutual fund, stock, and variable-insurance investment information. Thus, it seemed only sensible to go directly to the source. Looking at various lists of mutual funds with the Morningstar.com ranking tools resulted in quite a list of funds with 10-year annualized returns of not just 10%, but more than 20%. (See Figure 2.)
FIGURE 2: On 3/19/01, Morningstar's Fund Quickrank tool gave this list of US stock
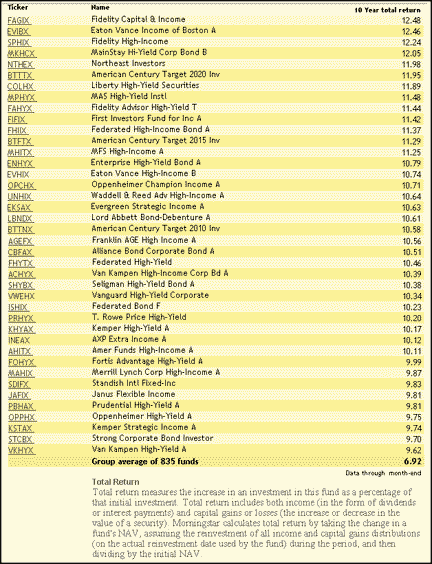
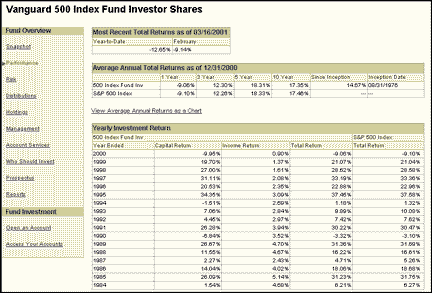
And here's something else that became evident looking at a list of US equity mutual fund returns: a lot of red ink. It was clear that many of the funds that flew so high during the last couple years of the long bull market have lost a big chunk of their winnings thanks to the bite of the bear, proof yet again that the market doesn't always go up. Sometimes it goes sharply and deeply down - the prime reason that I write a lot about long-term investing. I also decided to look at bond funds? in my research. I was not expecting to find double-digit returns in that area, but I did find some that were above the 10% bar. (See Figure 3.) Even with the ups and downs of the market, the Vanguard 500 Index Fund has managed an average annualized return of not 10%, but nearly 15% since its inception in 1976. (See Figure 4.) And it has done so with one of the lowest management fees in the industry. It doesn't take a financial genius to buy and hold that fund and just follow the market.
FIGURE 3: On 3/19/01, Morningstar's Fund Quickrank tool gave this list of bond funds
FIGURE 4: Vanguard's web page on its 500 Index Fund exhibits the ups and downs of the
FIGURE 5: Several of the funds on this list indicate good long-term gains, even with
If an index fund isn't your cup of tea, there are a number of other low-cost funds with long-term returns that are above the 10% mark. (See Figure 5.) While buying and selling individual stocks can eat up a lot of the market's average 10% returns, buying and holding a solid-performing no-load fund should keep you closer to a 10% constant. The last point that needs to be addressed is inflation. I wish I could tell you the 10% constant was adjusted for inflation, but it was not. That said, saving some of your income now in a tax-deferred Ira will at least help you keep up with whatever inflation there will be in the future. Even with inflation eating some of your savings, in the long run you are better off with a growing savings account than you are without one. KEEP THIS IN MIND Yes, there will be times when the market has big losses, which will be reflected in your overall return percentages. Yes, inflation will eat a big chunk of what you save. Yes, either now or later, depending on the type of Ira vehicle you use, taxes will shrivel what you have worked so hard to save. But in the long run, the positive trend of the market - and your intelligent choice of investment in same - should provide the overall 10% return used as the benchmark in my articles. Those inflation-ravaged, tax-attacked savings will still leave you much, much better off on the day you retire than the spend-now, hope-for-the-best alternative. Bruce Faber can be reached at BFaber@Traders.com. SUGGESTED READING Faber, Bruce R. [2001]. OThe Money Tree Grows Slowly - At First,O Working Money, Volume 2: March. Copyright © 2001 Technical Analysis, Inc. All rights reserved.
|
| Title: | Staff Writer |
| Company: | Technical Analysis, Inc. |
| Address: | 4757 California Ave. SW |
| Seattle, WA 98116 | |
| Phone # for sales: | 206 938 0570 |
| Fax: | 206 938 1307 |
| Website: | traders.com |
| E-mail address: | BFaber@traders.com |
Traders' Resource Links | |
| Charting the Stock Market: The Wyckoff Method -- Books | |
| Working-Money.com -- Online Trading Services | |
| Traders.com Advantage -- Online Trading Services | |
| Technical Analysis of Stocks & Commodities -- Publications and Newsletters | |
| Working Money, at Working-Money.com -- Publications and Newsletters | |
| Traders.com Advantage -- Publications and Newsletters | |
| Professional Traders Starter Kit -- Software | |
PRINT THIS ARTICLE

Request Information From Our Sponsors
- StockCharts.com, Inc.
- Candle Patterns
- Candlestick Charting Explained
- Intermarket Technical Analysis
- John Murphy on Chart Analysis
- John Murphy's Chart Pattern Recognition
- John Murphy's Market Message
- MurphyExplainsMarketAnalysis-Intermarket Analysis
- MurphyExplainsMarketAnalysis-Visual Analysis
- StockCharts.com
- Technical Analysis of the Financial Markets
- The Visual Investor
- VectorVest, Inc.
- Executive Premier Workshop
- One-Day Options Course
- OptionsPro
- Retirement Income Workshop
- Sure-Fire Trading Systems (VectorVest, Inc.)
- Trading as a Business Workshop
- VectorVest 7 EOD
- VectorVest 7 RealTime/IntraDay
- VectorVest AutoTester
- VectorVest Educational Services
- VectorVest OnLine
- VectorVest Options Analyzer
- VectorVest ProGraphics v6.0
- VectorVest ProTrader 7
- VectorVest RealTime Derby Tool
- VectorVest Simulator
- VectorVest Variator
- VectorVest Watchdog

