

HOT TOPICS LIST
- Strategies
- Stocks
- Buy
- Investing
- Brokers
- Psychology
- Interviews
- Accumulate
- Sell
- Hold
- Spotlight
- Websites
- Candlestick Corner
- Gold & Metals
- Options Trading
LIST OF TOPICS
INVESTING
Charts, Charts, Everywhere
05/30/01 02:30:13 PM PSTby Sharon Yamanaka
Charts, Charts, Everywhere
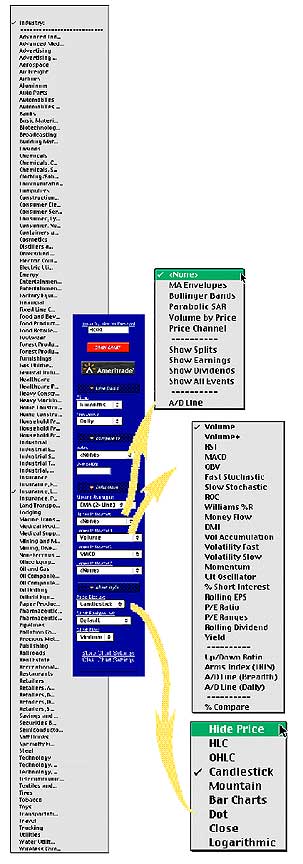
ONLINE CHARTING TOOLS A fully equipped charting website offers many, many choices -- more choices than you can shake a mouse at. Where do you start? Enter a symbol and select a time frame -- that is, the date the chart will begin and end. In addition, select a time interval -- from intraday to daily or weekly data, to data going back several years. A chart displays price data for either an index or a stock. You may want to compare a stock's price activity to an index, or to another stock in the same industry. Some sites give you this option. It usually involves selecting a comparison chart from a comparison section, which lists a number of indexes such as the Standard & Poor's 500, the Dow Jones Industrial Average (DJIA), the Nasdaq Composite, and the Russell 2000. Some sites, such as CBS MarketWatch, also include a lengthy list of sector indexes. (See Figure 1.)
When you compare two charts, you will notice the price scale on the x-axis will change to a percentage (also known as a percentage change chart), which makes for an accurate comparison. Next, select the indicators that will be overlaid on the price chart (referred to as upper indicators), and the indicators that will be displayed in a graph below the chart (lower indicators). Figure 1 shows BigCharts' selection of upper indicator, lower indicator, and price. IDENTIFYING THE INDICATORS Indicators are the meat of any interactive charting website. There are numerous indicators out there, and they are divided into upper and lower indicators. One of the basic upper indicators is the moving average. A simple moving average (SMA) removes the daily fluctuations in trading prices by taking an average of the last several days' worth of closing prices. For example, to determine a five-day moving average, add the closing prices for the last five days of the target stock, then divide it by five. On the following day, drop the oldest price and add the new closing-day price. Plot these points and you'll get a less-spiky, smoother price line. If you increase the number of days beyond five, you will find that the moving average is slower to respond to changes, but it is smoother. Another form of moving average is the exponential moving average (EMA) (Figure 2). It weights the simple moving average, favoring the most current closing prices. For example, for a five-day moving average, the current day's price may be weighted by 5x, meaning that you multiply that number by five. The previous day's price may be weighted by 4x, and the day before by 3x, down to the first price, which would be 1x. That would give you the equivalent of 15x days. Add the resulting numbers together and divide by 15 to get a weighted average for the five days. Because of this weighting, the EMA is more sensitive to changes in trends and quicker to pick up on reversals. When using EMAs, you can look at more than one moving average at the same time. Figure 2 displays a chart of Krispy Kreme Doughnuts, Inc. (Krem), with two EMAs. When the slow, blue EMA is below the red, fast EMA, the stock is declining. Conversely, when the fast line is above the slow line, the stock is trending up. When the two lines cross, it usually suggests a change in the stock's trend. Here's a list of several other indicators that can be overlaid on a chart, along with a brief description of what they do: MOVING AVERAGE ENVELOPESLOWER INDICATORS Lower indicators are plotted on a subgraph below the price chart. These indicators include: VOLUMESTART CHARTING Every charting website provides a different set of indicators -- tools you can use to customize charts, maximize your research, and improve your trading. (For examples of how charts can help you decide when to buy and sell stocks, see "Stocks And The Art Of Charts" at www.working-money.com.) The indicators mentioned here are only a handful of the total indicators used, but they are a good starting point. Now that you have a basic understanding of some of the more popular indicators, try your hand at them. You may just find they can clarify the movement of stock prices. Sharon Yamanaka can be reached at SYamanaka@Traders.com. SUGGESTED READING Penn, David [2001]. "Technical Analysis For The Masses," Working Money, Volume 2: January/February. Current and past articles from Working Money, The Investors' Magazine, can be found at Working-Money.com.
BIGCHARTS.COM BigCharts For Big Choices BigCharts is run by CBS MarketWatch.com. To get to the customizable charting section, click the red Interactive Charting button in the upper right corner of the opening screen. The customizable chart features will pop up in the left column (Figure 1, above). They are divided into the following categories: Time Frame, Compare To, Indicators, and Chart Style. Time Frame gives you choices ranging from one day to one decade to all data. The other upper and lower indicator selections are shown in the pulldown menus on the left.
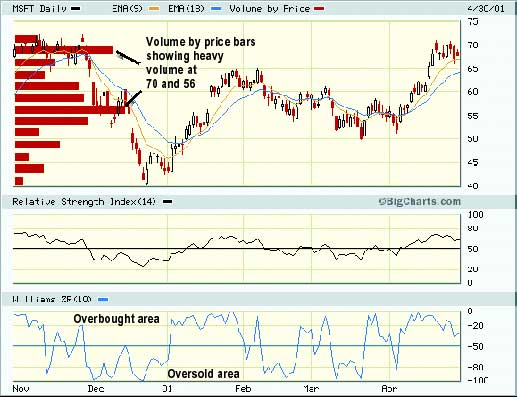
Using Microsoft as an example, I arbitrarily chose a number of indicators: Volume by price, exponential moving averages for the upper indicators, and relative strength index (RSI) and Williams' %R for the lower indicators. The price by volume indicator is probably the most telling, showing a lot of volume at 70 and what seems to be a resistance line that formed back in November 2000, and again in April 2001. The RSI is showing no overbought/oversold areas, although Williams' %R is.
YAHOO!FINANCE Below is the technical indicator screen of Yahoo!Finance's charting section. To get there, go to the financial section and enter a symbol in the Get Quote field. In this example, I used Ford Motor Co. (F) and changed the selection in the right-hand pulldown menu from Basic to Chart. Then I selected Technical Indicator to get the display.
Your choice of indicators is listed in the top of the display. If you click on any of the blue underlined words, they appear instantly on the chart. You can keep choosing different indicators until you find one that responds well to your target stock. Here, the stochastic diverges from the stock trend -- a signal that the trend may be changing.
STOCKCHARTS.COM StockCharts.com, the most technical of the websites, offers some of the more exotic indicators. To get to the customized charting section, look under the tools section of Tools and Charts and select SharpCharts. In the example below for CIENA Corp. (CIEN), I�ve used ZigZag and Aroon, as well as the popular Rate of Change (ROC) indicators. In the yellow highlighted area you can see where all three indicators are giving a buy signal. The Zigzag indicator is set for 7% and shows up as the green line overlaying the price bars. Zigzag draws a line only when the stock advances or declines by a pre-set percentage. It continues drawing that line in the same direction until there is a reversal. The area where the line reverses is known as a pivot point. A trader would buy in at certain points, usually when there is a trend and zigzag is going up or down in a series of lower lows or higher highs. The Aroon indicator is a type of oscillator. It creates two separate lines: Aroon up, which tracks the amount of time since a new high has been reached; and Aroon down, for new lows. Theoretically, a trend is defined as a series of new highs/lows following each other, so keeping track of the number of days since either event happened will help in picking out trends. Buy/sell signals are given when the indicator is at extreme highs or when Aroon up and down are parallel to each other. The Rate of Change (ROC) oscillator gives buy/sell signals when it goes into extreme values (zero being neutral), and when the ROC goes in an opposite direction from the price of a stock.
StockCharts.com came up with a unique idea in their Voyeur section. Here you can find out what other investors are doing on the site. To get there, go to the navigation bar to the left of the opening screen. Under Tools And Charts, click SharpCharts Voyeur. SharpCharts Voyeur brings up charts that have been �recently requested by StockCharts.com users.� I learned a lot by looking at other people�s work, not only the companies they were researching, but also how they used the indicators. From there, you can go to CandleGlance Voyeur (shown at left), which shows four of the most recently requested stock symbols, and updates constantly. You can pause or stop the updating, or study these charts in depth. | ||
CLEARSTATION.COM ClearStation ranks among the highest for most information displayed on the opening screen. It automatically displays a precalculated version of MACD, in both line and histogram form, and includes a stochastic chart. On the left side of the opening screen are significant, current news items. If you like the built-in decision-making tools and the interactive community, then you�ll find this site useful. Otherwise, use it as an overview.
PROPHETFINANCE.COM ProphetFinance has a number of different customized charting areas. Java Charting is the most sophisticated; it has indicator choices and the latest in interactive charting. As you roll your pointer over the chart, the black band at the bottom of the chart shows the date, high, low, close, volume, and position on the y-axis of your pointer position. You can draw trendlines and zoom in on specific dates on the chart. How do you get to the charts? In the upper-left corner of Prophet�s opening screen, you�ll find a palette. To access a pulldown menu, place your mouse over the Charts icon. From there, select Java Charting. On the new screen, enter your stock symbol. Under Tools, select Add Studies from the pulldown menu. There, you can choose your indicator.
3DSTOCKCHARTS.COM Specialty Charts 3DStockCharts.com does only one thing, but it does it well. As its name describes, it displays charts in three-dimensional form, incorporating volume into the price bars. These charts are for stock limit orders placed on the electronic communication networks (ECNs) of several of the largest ECN-based brokerages. ECNs automatically match up buyer and seller orders through a linked computer system. This allows you to see in stark clarity the buyer/seller dynamics. In the above example of Palm (PALM), a wall of buyers forms at 6.25.
Palm (PALM)
3D Krispy Kreme (KREM)
Likewise, on the chart to the right, of Krispy Kreme Doughnut Co. (KREM), a wall of sellers forms at 37. It�s likely that the price won�t pass 37 for a while. The charts can be rotated to get the best angle on the depth, and you can enlarge areas within the screen. The examples given here are from the full book selection. The top of the book selection breaks out the volume into the individual brokerages and shows the prices at which each individual broker is filling a particular stock order. Sometimes, you can see the majority of the stocks from one brokerage being filled at a fraction of a dollar less than the others, or you can see large orders going through one brokerage firm.
Copyright © 2001 Technical Analysis, Inc. All rights reserved. | ||
| Title: | Staff Writer |
| Company: | Technical Analysis, Inc. |
| Address: | 4757 California AVE SW |
| Seattle, WA 98116 | |
| Phone # for sales: | 206 938 0570 |
| Fax: | 206 938 1307 |
| Website: | www.Working-Money.com |
| E-mail address: | syamanaka@traders.com |
Traders' Resource Links | |
| Charting the Stock Market: The Wyckoff Method -- Books | |
| Working-Money.com -- Online Trading Services | |
| Traders.com Advantage -- Online Trading Services | |
| Technical Analysis of Stocks & Commodities -- Publications and Newsletters | |
| Working Money, at Working-Money.com -- Publications and Newsletters | |
| Traders.com Advantage -- Publications and Newsletters | |
| Professional Traders Starter Kit -- Software | |
PRINT THIS ARTICLE

Request Information From Our Sponsors
- StockCharts.com, Inc.
- Candle Patterns
- Candlestick Charting Explained
- Intermarket Technical Analysis
- John Murphy on Chart Analysis
- John Murphy's Chart Pattern Recognition
- John Murphy's Market Message
- MurphyExplainsMarketAnalysis-Intermarket Analysis
- MurphyExplainsMarketAnalysis-Visual Analysis
- StockCharts.com
- Technical Analysis of the Financial Markets
- The Visual Investor
- VectorVest, Inc.
- Executive Premier Workshop
- One-Day Options Course
- OptionsPro
- Retirement Income Workshop
- Sure-Fire Trading Systems (VectorVest, Inc.)
- Trading as a Business Workshop
- VectorVest 7 EOD
- VectorVest 7 RealTime/IntraDay
- VectorVest AutoTester
- VectorVest Educational Services
- VectorVest OnLine
- VectorVest Options Analyzer
- VectorVest ProGraphics v6.0
- VectorVest ProTrader 7
- VectorVest RealTime Derby Tool
- VectorVest Simulator
- VectorVest Variator
- VectorVest Watchdog