HOT TOPICS LIST
- Strategies
- Stocks
- Buy
- Investing
- Brokers
- Psychology
- Interviews
- Accumulate
- Sell
- Hold
- Spotlight
- Websites
- Candlestick Corner
- Gold & Metals
- Options Trading
LIST OF TOPICS
INVESTING
Is That Positive Rate Of Return Pie-In-The-Sky?
07/28/01 12:19:07 PM PSTby Morley Hudson
Don't let overly positive rates of return obscure the real picture. Try a rule of thumb to estimate time value of money.
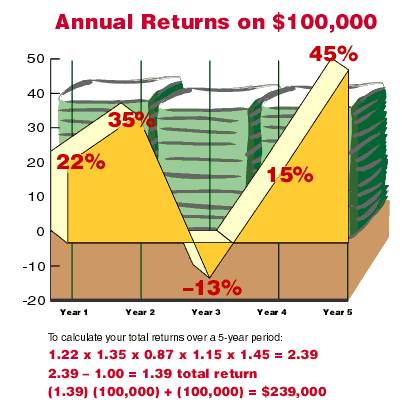
When you invest in the markets, your objective is to earn a positive rate of return, to earn money on your investment. But do you ever think about the effects of inflation or the time value of money when choosing your investments? If not, you're not alone. You can't possibly forecast what the future may hold for you; the best you can do is settle for that positive return. But positive returns don't necessarily take into account the time value of money, nor your purchasing power. In this article, I'll show you how to incorporate both into your investment selection criteria. START WITH RETURNS When evaluating a mutual fund, you often come across the term total return or rate of return. This is the key gauge of any investment. It is the total of all income (dividends, interest, income, capital gains distributions from mutual funds, rental income, net oil/gas income, timber income, and so on) plus the increase or decrease in an investment's market value. For example, a stock that paid 5% in dividends and gained 10% in market value during the year yields an annual total return of 15%. A bond that paid 5% interest during the year but lost 9% in market value results in a -4% annual total return. The hope for a positive return on your investment and the continued growth of that initial investment through compounding is what makes investing so attractive. Wasn't it Albert Einstein who once said, "Compound interest is the most powerful force on Earth"? It's true! Think of compounding as constantly earning interest on interest. For example, a $100 investment with a 10% total return each year for three years would give you the following:
Imagine how much an amount larger than $100 would produce! FIGURE IN THE TIME VALUE Another important term thrown around frequently in the finance world is the time value of money. To be significant, an investment's annual total return over the time you own it should be competitive with alternate forms of investing (unless it is a home or second residence, which also yields a return in the form of personal satisfaction). A home purchased for $100,000 in 1980 that's worth $250,000 in 2000 -- a 250% gain in 20 years -- has a 4.688% annual total return (or annual rate of return), plus the intangible, personal satisfaction of owning the property. But that's a home, and not quite comparable with other forms of investment. How about a mutual fund?
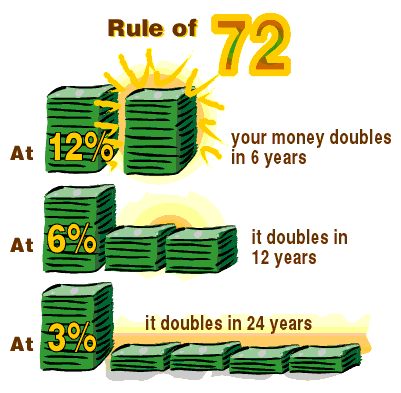
WHAT'S YOUR MONEY WORTH? One of the least-understood concepts of investing is preservation of purchasing power. For an investment to be valuable, its average annual total return over three years (or preferably five years) should at least equal the average increase in the cost of living for the average consumer over that time span (the cost-of-living rate is not the same as the inflation rate). Otherwise, the purchasing power of the assets being invested will drop by the difference between the consumer cost-of-living rate and the investment's total return. Between 1986 and 1996, the consumer cost of living increased an average of 7.75% annually, according to Sindlinger's Consumer Outlook Report, the microeconomic forecasting newsletter. This measurement differs from the US Department of Commerce's consumer price index (CPI). The CPI increased 3.68% annually over the same 10 years. Unfortunately, the general public presumes that the widely publicized CPI accurately represents the effect of inflation on their cost of living and their budgets. But that's not the case. Instead, a good way to determine your cost of living is to double the CPI number. DOUBLE-TIME: THE RULE OF 72 Now that you know the importance of compounding and inflation, how do you know what size return you need to meet your goals? A popular rule of thumb in estimating the time value of money and the conservation of purchasing power is the rule of 72. It's a simple calculation; just divide 72 by your dividend, interest rate, or total return. The result is the number of years it will take for your investment to double. For example, a 6% return doubles your investment in 12 years; a 12% return in six years; an 18% return in four years; and a 24% return in three years. Thus, a $1,000 investment with a 3% average return will double in 24 years. With a 6% return it will take 12 years for your investment to grow to $2,000. With a 12% return you can get $2,000 after six years (Figure 2). To obtain these results for your investments, you have to select the ideal investment instruments.
BONDS
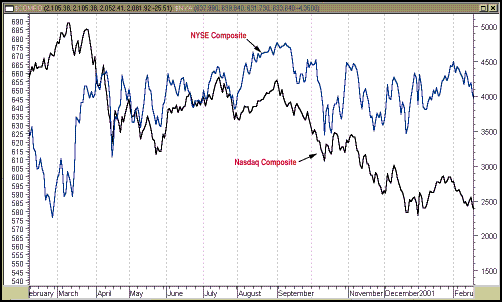
STOCKS Stocks and growth investment vehicles, the most popular investments, offer growth -- that is, an increase in price or value -- as the earnings of the company increase. A few pay annual dividends, but gain, growth, or increased total return is the principal feature of stocks or equities. Their performance is measured against stock market indexes -- the yardstick most investors use to get a feel for the condition of the market and the health of their stock and fund investments. Investors also use the indexes to measure and evaluate their own performance or that of the people they employ to manage their investments. MUTUAL FUNDS If you don't want to invest in individual stocks, you can always invest in equity or stock mutual funds, which offer full-time management or supervision of the stocks in the fund's portfolio. Such funds also offer automatic diversification of the stocks in the fund's portfolio as well as an extensive staff of stock analysts and other experts who investigate, evaluate, and rank stocks for potential inclusion in the portfolio. Once a company has been placed in the portfolio, the mutual fund constantly monitors it. It's difficult for a private investor who handpicks stocks for his or her personal portfolio to compete with the army of experts behind a mutual fund. Mutual fund performance varies. In 1999, there was one fund with an almost 500% total return, more than 100 funds with an over 100% total return, and some with losses. No-Load Fund Investor, a monthly newsletter published by Sheldon Jacobs, lists more than 50 funds with a 50%-plus annual rate of return over the past three and five years. My personal experience with mutual funds has been rewarding, but I only discovered them after learning the hard way. By the mid-1950s I had accumulated an extensive collection of stocks based on recommendations of various account executives or stockbrokers at brokerage firms, plus hot tips from acquaintances. I had been busy starting a new business, so I paid little attention to the market -- much less my stocks. One day it dawned on me that no one had ever called me to sell a stock that had attained the original target price level proposed for the buy recommendation. In fact, no account executive had ever called to suggest that I replace a stock that had either already performed well or wasn't performing as expected with one that had a greater potential. It was then that I realized there had to be a better way. This led to my eventual discovery of mutual funds with their full-time management, built-in diversification, a track record that is available for perusal every night, no sales costs with no-load funds, and great statements for doing tax returns. I felt I had finally discovered the better way. I have invested in mutual funds for almost 50 years, and served as a director of a US gold fund for about six years, during which time it was the top-performing fund among gold funds from 1979 to 1981. PUT YOUR KNOWLEDGE TO WORK A group of experienced mutual fund investors, with whom I have been collaborating for more than 11 years, long ago confirmed what Gerald Appel and Ned Davis, two top investment gurus, concluded in the Systems And Forecasts newsletter: "Over 75% of stock market gains occur when the Nasdaq is the dominant market over the NYSE." Further, all deep corrections and bear markets occur while the NYSE is the dominant market index. Witness the recent April NYSE correction and the Nasdaq bear market, in which the NYSE became dominant on March 30. (See Figure 3.)
If you are a serious buy-and-hold investor (not a market timer) with a stock or mutual fund portfolio, I urge you to at least get a Monday edition of Investor's Business Daily and study the first three ranking columns in the stock listings and the 52-week highs and lows. Find your stock(s) in this ranking and price band. For information on mutual fund performance, read the first two pages of the second section, especially the status of the 20-fund IBD mutual fund index (in the back of the front section) and the current price of your fund(s). You may wish to consider redeeming if the price drops 10% below its most recent high price. Investing in positive-return instruments is a desirable goal, but keep in mind the time value of money and your cost of living. Use the rule of 72 and keep abreast of where your investments -- whether they are stocks or mutual funds -- stand in relation to the best-performing ones. The late Morley Hudson was a mechanical engineer and former Louisiana State Representative. REFERENCES Appel, Gerald [1990]. The Advanced Moving Average Convergence-Divergence Trading Method, videotape and manual, Signalert Corp.
%A0 SIDEBAR: HOW THOSE INDEXES WORK The Dow Jones Industrial Average (DJIA), which consists of 30 stocks, has always been the measurement of choice for the news media. With the proliferation of business enterprises and a global economy, the DJIA is at best a guide to measure performance. The Standard & Poor's 500 index, which consists of the 500 largest-capitalization US or domestic stocks, is the yardstick used to evaluate diversified mutual funds or the performance of asset managers. Capitalization refers to the number of shares outstanding multiplied by the share price, fromwhich we get the terms large cap, mid cap, small cap, and micro cap. These indexes provide insight into market conditions. The advancing and declining prices and the volume of the New York Stock Exchange (NYSE) index, another broad index, are frequently used in technical analysis to measure the health of the overall market. The McClellan oscillator and the McClellan summation index, used to determine changes in major trends, are based on the NYSE advance/decline price and volume data. In addition, new highs and new lows are considered excellent indicators of market condition. For more information on advancing and declining issues, visit Working-Money.com. The Nasdaq Composite (formerly referred to as the over-the-counter, or OTC) consists of all stocks traded on the Nasdaq exchange (more than 5,000). It is the measure of smaller companies and stocks and is considered the more volatile index. Technology stocks make up a large portion of this index. The Nasdaq 100 (NDX) -- the 100 largest companies of the Nasdaq, less financial stocks -- and the Nasdaq 100 index-- tracking stock (QQQ) are the best measures of the technology and information age stock market. Here again, the advancing/declining prices and volume and the new highs and new lows of the Nasdaq are important technical analysis indicators for the Nasdaq market. --M.H.
Current and past articles from Working Money, The Investors' Magazine, can be found at Working-Money.com.
Copyright © 2001 Technical Analysis, Inc. All rights reserved. |
| Address: | Undisclosed |
| Shreveport, LA 71106 | |
| Phone # for sales: | 318 868 9405 |
| Fax: | 318 868 6555 |
| E-mail address: | morleyhudson@prodigy.net |
PRINT THIS ARTICLE

Request Information From Our Sponsors
- StockCharts.com, Inc.
- Candle Patterns
- Candlestick Charting Explained
- Intermarket Technical Analysis
- John Murphy on Chart Analysis
- John Murphy's Chart Pattern Recognition
- John Murphy's Market Message
- MurphyExplainsMarketAnalysis-Intermarket Analysis
- MurphyExplainsMarketAnalysis-Visual Analysis
- StockCharts.com
- Technical Analysis of the Financial Markets
- The Visual Investor
- VectorVest, Inc.
- Executive Premier Workshop
- One-Day Options Course
- OptionsPro
- Retirement Income Workshop
- Sure-Fire Trading Systems (VectorVest, Inc.)
- Trading as a Business Workshop
- VectorVest 7 EOD
- VectorVest 7 RealTime/IntraDay
- VectorVest AutoTester
- VectorVest Educational Services
- VectorVest OnLine
- VectorVest Options Analyzer
- VectorVest ProGraphics v6.0
- VectorVest ProTrader 7
- VectorVest RealTime Derby Tool
- VectorVest Simulator
- VectorVest Variator
- VectorVest Watchdog


