

HOT TOPICS LIST
- Strategies
- Stocks
- Buy
- Investing
- Brokers
- Psychology
- Interviews
- Accumulate
- Sell
- Hold
- Spotlight
- Websites
- Candlestick Corner
- Gold & Metals
- Options Trading
LIST OF TOPICS
INVESTING
Earnings and Cash Flow: Watching What Matters
07/28/01 12:21:06 PM PSTby David Penn
Price-to-earnings and price-to-cash flow are among the most common ways to measure a company's health. What are these ratios and how can you use them to invest in the best companies?
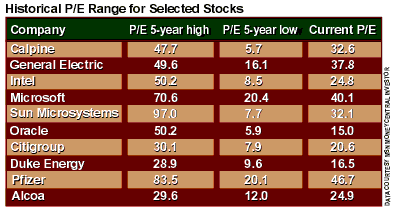
As far as some investors and other observers and analysts of the stock market are concerned, there are two things a company must do in order to survive: develop a cash flow, and reap profits -- better known in the business world as earnings. At the same time, using measurements such as price to earnings (P/E) ratios and price to cash flow can be tricky for average investors who are looking for assistance choosing between stocks. As is often the case in investing, none of this provides any hard and fast rules -- even the old bull market adage about never selling short a high P/E stock appears in need of revision, as a number of previously high-flying Internet and technology stocks plunged in value when their revenues (to say nothing of their earnings) dried up. Despite recent anomalies, because these ratios remain important methods of comparing stocks to other stocks, as well as comparing stocks to benchmarks such as the Standard & Poor's 500, knowing just what they are and how they can be used effectively is important for everyone who invests in the stock market. BRIGHT FUTURE? BIG EARNINGS In many ways, earnings are the measure of the market. A company's ability to realize profits from its business activity is key to company growth. Profits are what pay for expansion into new markets, research and development into new products and services, and better wages and benefits for workers. It is no exaggeration to say that profits -- or earnings -- are what makes the business world go 'round. As Aswath Damodaran, professor of finance at New York University's Leonard N. Stern School of Business, points out in Damodaran On Valuation, there are three main reasons why the price to earnings ratio (also known as the earnings multiple) is a popular measurement of stocks. For one, the comparison between a stock's price and its earnings per share has a certain common sense attraction (Damodaran calls it "intuitively appealing"). In addition, P/E is relatively easy to compute (dividing market value per share by earnings per share), making it an accessible tool for all stock investors. Finally, the earnings multiple can be helpful in understanding other aspects of the stock, such as risk and perceptions of future growth (generally, higher P/Es relative to the P/E of the stock market indicate both increased risk and optimism for future growth). There are downsides to price to earnings ratios, however. It is possible for a company's P/E ratio to be misleading when earnings are low or when earnings per share are negative. On the surface, these companies may appear to be growth machines with P/Es that are two, three, or four times that of the market. In reality, however, their P/Es are high because their earnings are so low. The recent situation with many Internet stocks was a perfect example of P/E ratios being relatively high based largely on the fact that many of these companies had little or nothing in the way of earnings. It is true the inflated P/Es of many companies such as Ciena Corp. (CIEN), Qualcomm, Inc. (QCOM), and Protein Design Labs (PDLI) probably did represent "greater%A0 optimism for future growth." But as this optimism peaked, Federal Reserve chairman Alan Greenspan's infamous comment about "irrational exuberance"%A0 in the markets became the more appropriate phrase. As far as "increased risk" is concerned -- well, we all know where Priceline.com, Inc. (PCLN), and VA Linux Systems, Inc. (LNUX), stock prices are now.
Significant earnings volatility, or the tendency of earnings to change dramatically from one period to the next, is another element that can reduce the helpfulness of the P/E ratio as an indicator of company health. This is especially likely when examining the stocks of cyclical companies, such as retailers. When these companies are in the upswing of their business cycle or season, earnings are usually up strongly. However, when the cycle moves on or the season changes, these same retailers can suffer a major change in their profitability. These earnings mood swings are reflected in the company's P/E -- which means a given company can show wide variance in P/E over a relatively short period. CASH FLOW IS KING Writing for The Financial Times Global Guide To Investing, Terry Smith, an accountant and author of Accounting For Growth, noted that while "calculation of profits incorporates a number of subjective judgments%A0 %C9 the same is not true of cash." This summation is at the heart of the slogan: Cash is king. Stock value may go up and down dramatically. Debt instruments may boom and bust. Save for periods of extreme inflation, however, cash is always cash. And cash, the last refuge for fearful investors, is very much the lifeblood of corporate America. When disputes arise over earnings, cash flow per share is one substitution that many stock analysts choose. Corporations service debt with cash, by paying dividends, and financing stock buybacks. When stock values are low, cash can help provide the fuel for mergers and acquisitions. Because fewer companies pay dividends on their stocks today than was the case in decades past, more companies are potentially able to raise larger sums of cash. When a company's stock appreciates, this can be a double boon -- as is the case, for example, with a company such as Microsoft, whose combination of cash flow and stock appreciation has helped the company in both weak markets and strong. There are a number of ways to look at and measure how well a company raises and manages its cash. Cash flow itself is measured by combining a company's net income with depreciation and other noncash items (such as amortization). Cash flow can also be examined on a per share basis, as in cash flow per share. An increasingly popular way to look at cash flow, however, is to consider what is referred to as free cash flow, which takes into account operating earnings after taxes less capital expenditures. Free cash flow is preferred over cash flow because free cash flow is thought to be more difficult to manipulate through accounting methods and is generally less vulnerable to the discretion of managers (who can temporarily alter cash expenditure plans in order to create a better cash flow picture for investors). Two ratios are also commonly used in studying cash flow. Note that cash flow and free cash flow alone will provide a figure for a company, but that figure may not be enough to determine, for example, how the cash flow of one company compares with the industry or sector standard. It can also be difficult to use cash flow or free cash flow to compare companies in different industries where cash needs may vary widely. For these reasons and others, the free cash flow to earnings ratio and the quick ratio have been used. The free cash flow to earnings ratio shows just what fraction of earnings can be translated into cash and, thus, into further investment, expansion, dividend payment, and so on. A free cash flow to earnings ratio of 1:2, for example, would mean that half of the company's earnings are free cash. Generally, a value between 0.5 and 1.0 is considered strong. The quick ratio also gives an assessment of how efficiently capital is being raised and deployed. Also known as the acid-test ratio, the quick ratio considers current assets less inventory, all divided by current liabilities. Here, a ratio of 1:1 is preferable, demonstrating that the company has the cash to retire its liabilities in a relatively short period. A lower quick ratio suggests that a company may be having trouble, either with excess liabilities (such as debt) or insufficient current assets (such as poor earnings). RULES FOR RATIOS Keith Tufte, director of equity research at American Express Financial Advisors, compares buying low P/E stocks to shopping during a sale. While it is true that, more often than not, stock investors get what they pay for (meaning cheap stocks often stay cheap), there can be distinct advantages to buying stocks whose P/E ratios are less than or equal to the company's projected growth rate. "Right now, the average stock in the stock market trades at about 25 times earnings (P/E of 25)," Tufte explains. "So if you can find a company that's growing at 20% and you can pay 20 times earnings in P/E ratio or less, that's one way to get a pretty good deal." This is why Tufte recommends that investors look not only at price to earnings ratios but also at the relationship between P/E and growth. The PEG ratio, as it is called, is a measure of price to earnings to growth and indicates to investors, essentially, "what they are paying for growth." He finds this preferable to other methods of comparing P/E ratios, such as comparing P/Es of stocks to the general P/E of the market to determine whether a stock is undervalued compared to the market. (PEG may be calculated by dividing a company's P/E ratio by its projected earnings growth rate.) "The problem with [those comparisons] is that certain industries always trade at lower P/E ratios," Tufte says, including both banks and cyclical industries, which tend to trade more in the range of 10 or 15 times earnings. "So you can get fooled into thinking that bank stocks are cheap, but in reality they just always trade at a discounted P/E to the average stock in the market." One way out of this conundrum for investors who like to compare P/Es in this fashion is to use relative P/E charts (current P/E divided by a five-year average P/E) that take into account how a particular sector's P/E has moved historically. "For example, banks usually trade at 60-70% of the P/E ratio of the market. So when people really hate banks, [banks] get down to 50% or half the P/E of the overall stock market," Tufte notes. "And when the banks rally and do well, they get up to maybe 75-80% of the P/E ratio of the overall market. That is sort of the range of banks at 50-80%. So if you look back and then try to figure out where we are now -- that is, I think, a better way to do it than just looking at anything that trades at a discount." Adds Tufte, if you only purchased low P/E stocks: "You'd have a portfolio full of banks and cyclical commodity companies and you'd never own any technology stocks and hardly any health care" -- a lopsided portfolio, to say the least. MAKING PRICE TO CASH FLOW WORK When it comes to cash flow, Tufte prefers plain old price to cash flow over some of the other methods of valuing the way a company generates cash. Many companies, in fact, are often more accurately valued when assessed based on price to cash flow, as opposed to P/E. These companies include cable and telecommunications companies, which often have massive depreciation charges based on a historical outlay for infrastructure. Because reported earnings can be swallowed almost whole by this huge depreciation, analysts and investors will choose price to cash flow as the preferred substitute. "The same is true with many of the media companies," Tufte adds. "They don't have particularly high reported earnings. Therefore, people look at price to cash flow." The quick ratio, mentioned previously, can be a helpful tool in evaluating overall liquidity. But Tufte is not sold on the quick ratio as a proxy for the company's cash flow position. "Quick ratio is just current assets to current liabilities. That's a balance sheet ratio, and it just tells you how liquid [the company's] assets are on their balance sheet. But for any company that's not about to go bankrupt, [quick ratios] are not an important issue for most investors." VALUATION CREATION As Tufte notes, companies have a tendency to promote whichever valuation measurement presents the most positive view of their company. "It's kind of funny; it's whatever industries have to report. Decent reported earnings? Then you use earnings. And industries where they don't have decent reported earnings have to get a little more creative with the valuation." This sort of creativity, he says, is exactly what took place during the peak of the stock market bubble -- particularly with Internet stocks. "A lot of these Internet companies didn't have earnings, so then you go to cash flow, right? Well, they didn't have cash flow, either. So then you go to revenues, price to revenues ratios, price to sales ratios. And many of them didn't even have revenues. So then they started looking at price to number of clicks on their website or something." The lesson? It depends on your investment approach. Value- or bargain-oriented investors seek out companies with P/Es lower than that of the general market. Growth investors need to keep a close eye on the rising P/Es of their preferred stocks. And cash flow per share -- again, a 1:2 ratio or better -- is important for all investors to monitor. "Whenever you get to extremely creative valuation," Tufte observes, "that's a big red flag for investors to watch out, because the further you get away from reported earnings or reported cash flow, the more likely it is that it isn't a solid investment." As far as Tufte is concerned, even price to sales or price to revenues -- often the staple valuation measurement of young, growing companies -- should be taken with a grain of salt. These companies, often with great ideas and large potential markets but with few initial sales, may use price to sales. And, in fact, many larger technology companies such as Ariba, Inc. (ARBA), and Siebel Systems, Inc. (SEBL), still use price to sales because of relatively low earnings and cash flow. "Again," Tufte says, "they typically do that because their P/E ratio is over 40 or 50, and the price to cash flow ratio looks really expensive, as well." Does that make companies such as Ariba and Siebel -- to say nothing of giants such as Cisco Systems, Inc. (CSCO), that use price to sales -- poor investments? It depends. Concludes Tufte: "The further you get away from valuation techniques that talk about earnings or cash flow, the more skeptical I become." David Penn may be reached at DPenn@Traders.com. SUGGESTED READING Damodaran, Aswath [1994]. Damodaran On Valuation: Security Analysis For Investment And Corporate Finance, John Wiley & Sons. Current and past articles from Working Money, The Investors' Magazine, can be found at Working-Money.com.
Copyright © 2001 Technical Analysis, Inc. All rights reserved. |
Technical Writer for Technical Analysis of STOCKS & COMMODITIES magazine, Working-Money.com, and Traders.com Advantage.
| Title: | Traders.com Technical Writer |
| Company: | Technical Analysis, Inc. |
| Address: | 4757 California Avenue SW |
| Seattle, WA 98116 | |
| Phone # for sales: | 206 938 0570 |
| Fax: | 206 938 1307 |
| Website: | www.traders.com |
| E-mail address: | DPenn@traders.com |
Traders' Resource Links | |
| Charting the Stock Market: The Wyckoff Method -- Books | |
| Working-Money.com -- Online Trading Services | |
| Traders.com Advantage -- Online Trading Services | |
| Technical Analysis of Stocks & Commodities -- Publications and Newsletters | |
| Working Money, at Working-Money.com -- Publications and Newsletters | |
| Traders.com Advantage -- Publications and Newsletters | |
| Professional Traders Starter Kit -- Software | |
PRINT THIS ARTICLE

Request Information From Our Sponsors
- VectorVest, Inc.
- Executive Premier Workshop
- One-Day Options Course
- OptionsPro
- Retirement Income Workshop
- Sure-Fire Trading Systems (VectorVest, Inc.)
- Trading as a Business Workshop
- VectorVest 7 EOD
- VectorVest 7 RealTime/IntraDay
- VectorVest AutoTester
- VectorVest Educational Services
- VectorVest OnLine
- VectorVest Options Analyzer
- VectorVest ProGraphics v6.0
- VectorVest ProTrader 7
- VectorVest RealTime Derby Tool
- VectorVest Simulator
- VectorVest Variator
- VectorVest Watchdog
- StockCharts.com, Inc.
- Candle Patterns
- Candlestick Charting Explained
- Intermarket Technical Analysis
- John Murphy on Chart Analysis
- John Murphy's Chart Pattern Recognition
- John Murphy's Market Message
- MurphyExplainsMarketAnalysis-Intermarket Analysis
- MurphyExplainsMarketAnalysis-Visual Analysis
- StockCharts.com
- Technical Analysis of the Financial Markets
- The Visual Investor