HOT TOPICS LIST
- Strategies
- Stocks
- Buy
- Investing
- Brokers
- Psychology
- Interviews
- Accumulate
- Sell
- Hold
- Spotlight
- Websites
- Candlestick Corner
- Gold & Metals
- Options Trading
LIST OF TOPICS
FINANCIAL PLANNING
Okay, The Bill Did Pass. Why Aren't I Happy?
07/27/01 03:45:35 PM PSTby Bruce R. Faber
Though the new tax bill incorporates some long-overdue appreciation to IRA contribution amounts, the bill that did pass will leave us much further behind the curve in saving for retirement than the bill that didn't pass.
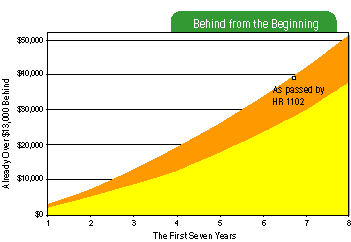
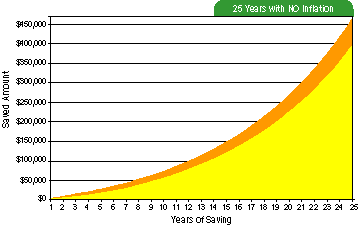
While it is true that half a loaf is better than none and beggars can't be choosers, it is unclear why the American people need to settle for half a loaf, nor why they have to be beggars in the first place. What is obvious, at this point, is that it seems they must. The new tax bill bulled its way through the US Congress with the much-anticipated individual retirement account (IRA) increases staked out. The meat of the bill looked pretty much the same as the original version that found itself stalled in the Senate, but it is a much different cut. What passed the House 401-25 on July 19, 2000, in Representative Rob Portman's (R-OH) HR 1102 was a fair and substantial attempt at giving IRA contributions a chance to catch up to inflation. The rules written into HR 1102 were especially important for those nearing their retirement years. However, the IRA critter that finally got through the US Senate's financial fence this year is a cow of a much different color. WHAT IS THE SAME In both HR 1102, from 2000, and HR 1836.EH, the tax bill that was signed into law on June 7, 2001, there is a stepped increase in the contribution amounts from the current $2,000 per year to an eventual $5,000 per year. In both cases the contribution is adjusted for inflation after the $5,000 step is reached. In addition, both bills give those who are 50 and over a chance to partly catch up for the years they were unable to make contributions, or to help make up for what was lost to the bite of inflation. WHAT'S NOT THE SAME So what's the big difference? If Rep. Portman's bill had gone through the Senate last year, the contribution limit would have been $3,000 this year (2001), $4,000 in 2002, and by 2003 would have reached $5,000 and been adjusted for inflation the years following. Not so with HR 1836.EH, The Economic Growth and Tax Relief Reconciliation Act of 2001. The increased amounts now look like this: $3,000 for 2002-04, $4,000 in years 2005-07, $5,000 finally in 2008, and thereafter adjusted, more or less, for inflation's spiral. No need for a rocket scientist to figure out that we lose an extra five years (and the associated savings and interest) getting to the $5,000 level. IT'S LIKE THIS If an IRA account was opened and fully funded at the beginning of 2001, Figure 1 shows the possible $13,510 loss attributable to the increase in time before the $5,000 contribution level is reached. As with all of my articles for Working Money, the calculations for IRA growth are based on a yearly return of 10%. At the end of seven years there will be more than 25% less to grow for the retirement years. Figure 2 shows how that initial loss compounds over the next 25 years. And that's if there is no inflation after 2008. I don't think so.
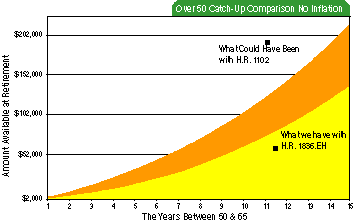
When it comes to catch-up contributions for individuals 50 and older, in Portman's HR 1102 the contribution would have equaled 150% of the amount normally allowed for that year. It could never come close to making up for investing earlier in life. The compound interest over the long run is much too powerful, but it was a helpful crutch for those who didn't or couldn't invest earlier.
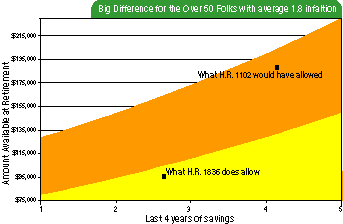
In HR1836.EH, however, for an individual who has attained the age of 50 before the close of the taxable year, the contribution amount for such taxable year shall be increased by $500 in 2002 through 2005, and by $1,000 for 2006 and beyond. This may not sound like much of a change, but Figure 4 shows that it does make a difference. Figure 5 makes this difference clearer by showing what was taken away from the over-50 folks by focusing on just the last five years of the 50-to-65 time frame. Maybe come November, they will forgive and forget what was taken from them by the senators in power -- but not likely. FROM AGED BEEF TO GROUND ROUND Here's how the cost-of-living adjustment works for the years after 2008. The $5,000 amount will be increased by an amount equal to such a dollar amount, multiplied by the cost-of-living adjustment for the calendar year in which the taxable year begins. That would be really good news -- if only it had been left right there.
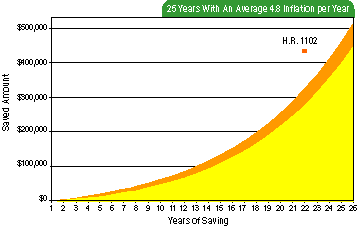
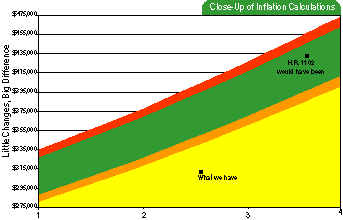
Instead, some more bad news comes in the form of the rounding rule. If the cost-of-living adjustment amount is not a multiple of $500, such amount shall be rounded to the next lower multiple of $500. If I understand this, it means we have to be at least $499.99 behind inflation before we can reflect our loss in our saving's limit. Over the next 25 years, that may only amount to somewhere around $10,000. (See Figure 6 and sidebar.) While that may not seem like a lot to the rich or to someone drawing a Congressional salary, it looks like a bunch to me. TRYING TO KEEP UP WITH INFLATION To say that the savings rate in the US is poor would be a gross understatement. At times in the past year the savings rate has actually hit negative territory, according to the US Bureau of Economic Analysis. Americans were actually spending more money than they were making. Even though personal incomes were increasing, personal spending was increasing at a faster rate. Through a combination of selling their investments, going further into debt, or withdrawing from savings accounts, Americans managed to spend $100.40 for every $100 of income. In times of hyperinflation, that is a good strategy because inflation devalues the amount of money you've saved. In the current atmosphere of relatively low inflation, it is not a good strategy. Could this low savings rate be partly to blame on the lack of incentive for saving? Obviously, a negative savings rate is not a sustainable option for the future. Sooner or later, something has to change. The longer the change is put off, the more drastic such a change will have to be. You need to look no further than the current energy crisis to understand that taking out more than is available leads to major problems. Fixing this kind of situation after the fact is always more painful, both financially and personally, than correcting the problem in advance of the otherwise guaranteed disaster. WHAT CAN WE DO? First, we need to be delighted that we finally have a catching-up process in place! Second, we need to start putting money into our IRAs. Third, we need to encourage our senators to give back the cuts they took from HR 1102. This is especially true of those who already are, are near, or ever plan on, being over 50. To contact them, we have various options, but e-mail seems to find some kind of huge Congressional Delete option, since my e-mail seems to disappear and never be acknowledged. Letters can be trashed, but generally are not. Phone calls often get through, and even get returned. Showing up in person at a senator's office (with a copy of this article in hand) would probably be the most effective and is highly recommended for those who live close enough to one of the local offices maintained by the senators. No need to be eloquent, just point to one of the graphs included and ask them to explain why we are so far behind the curve. Bruce Faber may be reached at BFaber@Traders.com. SUGGESTED READING Faber, Bruce R. [2001]. "Long-Term Returns: What's Realistic And What's Not?" Working Money, Volume 2: June.
Sidebar: BILL COMPARISON The reason any kind of new IRA bill was ever needed is simply inflation. As commodities become more scarce in the face of an ever-increasing population, the law of supply and demand drives up prices. The workforce then needs more money to pay the higher prices. That increases the price of services, which adds to the problem. There have been brief periods of deflation, but in the long run, inflation rules. The Bureau of Labor Statistics keeps track of inflation through a medium known as the consumer price index. Currently, the years between 1982 and 1984 are used as the 100 mark on the index. More specifically, July 1983 is 99.9 and August 1983 is 100.2. As of April 2001, the index was at 176.9. The index 25 years before, May 1976, was at 56.5. A little subtraction shows that it results in a gain of 120.4, which divided by 25 gives an average yearly increase of 4.816. If the future turns out to be a mirror of the past, as is often the case, then an average inflation of 4.8% may be about what we can expect in the next 25 years. Using that rationale, all of the graphs in this article and sidebar that involve inflation use a simple 4.8 yearly inflation factor. --B.F. Current and past articles from Working Money, The Investors' Magazine, can be found at Working-Money.com.
Copyright © 2001 Technical Analysis, Inc. All rights reserved. |
| Title: | Staff Writer |
| Company: | Technical Analysis, Inc. |
| Address: | 4757 California Ave. SW |
| Seattle, WA 98116 | |
| Phone # for sales: | 206 938 0570 |
| Fax: | 206 938 1307 |
| Website: | traders.com |
| E-mail address: | BFaber@traders.com |
Traders' Resource Links | |
| Charting the Stock Market: The Wyckoff Method -- Books | |
| Working-Money.com -- Online Trading Services | |
| Traders.com Advantage -- Online Trading Services | |
| Technical Analysis of Stocks & Commodities -- Publications and Newsletters | |
| Working Money, at Working-Money.com -- Publications and Newsletters | |
| Traders.com Advantage -- Publications and Newsletters | |
| Professional Traders Starter Kit -- Software | |
PRINT THIS ARTICLE

Request Information From Our Sponsors
- StockCharts.com, Inc.
- Candle Patterns
- Candlestick Charting Explained
- Intermarket Technical Analysis
- John Murphy on Chart Analysis
- John Murphy's Chart Pattern Recognition
- John Murphy's Market Message
- MurphyExplainsMarketAnalysis-Intermarket Analysis
- MurphyExplainsMarketAnalysis-Visual Analysis
- StockCharts.com
- Technical Analysis of the Financial Markets
- The Visual Investor
- VectorVest, Inc.
- Executive Premier Workshop
- One-Day Options Course
- OptionsPro
- Retirement Income Workshop
- Sure-Fire Trading Systems (VectorVest, Inc.)
- Trading as a Business Workshop
- VectorVest 7 EOD
- VectorVest 7 RealTime/IntraDay
- VectorVest AutoTester
- VectorVest Educational Services
- VectorVest OnLine
- VectorVest Options Analyzer
- VectorVest ProGraphics v6.0
- VectorVest ProTrader 7
- VectorVest RealTime Derby Tool
- VectorVest Simulator
- VectorVest Variator
- VectorVest Watchdog

