HOT TOPICS LIST
- Strategies
- Stocks
- Buy
- Investing
- Brokers
- Psychology
- Interviews
- Accumulate
- Sell
- Hold
- Spotlight
- Websites
- Candlestick Corner
- Gold & Metals
- Options Trading
LIST OF TOPICS
INVESTING
Volume Speaks Volumes
09/28/01 12:57:46 PM PSTby Dennis D. Peterson
Sometimes the market roars and at other times it's quiet. Paying attention to these volume fluctuations can make a difference in your pocketbook.
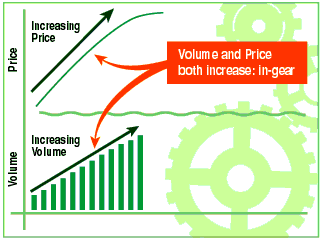
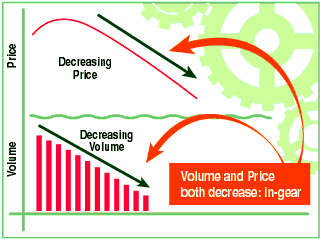
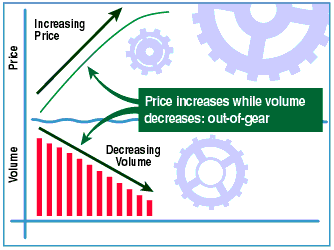
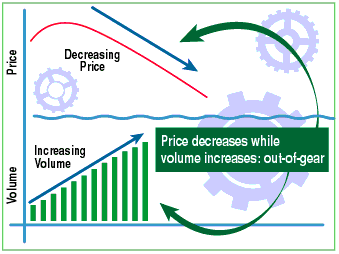
Suppose someone offered you something you wanted, for less than it cost two weeks ago. Would you turn it down? What if everyone in your neighborhood had heard about it and they all wanted it too? Would they turn it down? These same dynamics are at play in the stock market -- and volume is a tool that can help you decipher them. If a stock is perceived to be a bargain, then the whole neighborhood will jump in. If it's perceived to be too expensive, then not many will buy it. UNDERSTAND MARKET MOVEMENTS Before going any further, you need to understand two basic types of price and volume movement. A rise in prices together with an increase in the number of shares traded -- also known as volume -- is called an in-gear price move. The demand for the stock has driven the price up, and therefore, price and volume are working together. The movement is still in gear when stock prices decline and volume decreases. As the stock price goes down, there are fewer sellers because the price is then perceived to be a bargain. The price decline doesn't stimulate much trading. When price and volume move in opposite directions, it's considered an out-of-gear move. This occurs when prices are moving up and volume is decreasing or when prices are declining and volume is increasing (see Figures 1-4).
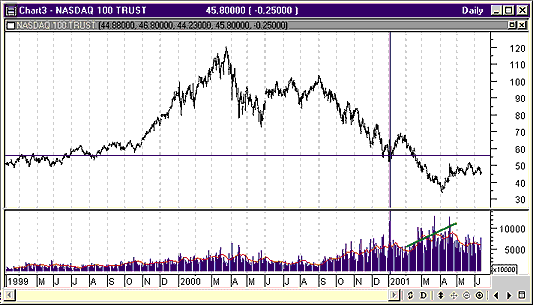
But neither in-gear nor out-of-gear movements can last forever. Think of price as a ball attached by an elastic band to something relatively stationary such as a ping-pong paddle. The force on the ball will be the greatest when the ball is farthest away and the elastic is stretched the most. You also need to recognize that the "relative stationary" object does not have to be horizontal -- it could be slanted up or down. You may have heard of exhaustion tops and selling climaxes. Both are extensions of the ping-pong paddle example. These points are areas where the elastic is the most stretched. Exhaustion tops are a two- to five-day sudden increase of price and volume, while selling climaxes are just a two- to five-day sudden decrease of price accompanied by a sudden increase in volume. When prices are rising with increased volume or prices are falling with decreasing volume (in-gear moves), it suggests the market has found a price it is comfortable with. There is some predictability in the direction of the price. Have you ever wondered why so many people use a 20-day or 50-day moving average as a buy or sell signal? If a price is above the 20-day (or 50-day) moving average, they buy, and if it is below, they sell. It works best if the stock is in a trend, but it also works because the 20-day (or 50-day) moving average roughly represents the comfort zone of the stock (keep reading for a definition). Often, prices tend to return to the 20-day (or 50-day) average. But the market is notorious for its unpredictability. Why do these unexpected, irrational moves occur? Basically, there are two powerful emotions that govern the market: greed and fear. These two emotions can be seen in a market that is out of gear. If prices rise while volume decreases it means that the few who are buying are doing so because of greed. Similarly, if prices are falling with increasing volume, then fear is the more dominant emotion. Recognizing the dominance of fear or greed, and recognizing when that emotion changes, will give you greater insight into the market. UNDERSTANDING THE SHIFTS An easy way to understand these shifts from one emotion to the other is to think about the buyers and sellers. If prices are moving down on increased volume, it means there is an abundance of sellers, whereas if they are moving down on decreased volume, there is a lack of sellers. If prices are rising with higher volume, there is an abundance of buyers. If prices rise on lowered volume, it means there is a lack of sellers. The purpose of investing in the market is to make a profit. But how do you know that a price trend has come to an end and it's time to sell? MARKET TOPS AND BOTTOMS Generally, when prices are moving higher on increasing volume, by definition the greatest volume is at the highest price. Similarly, an in-gear down move starts with the highest volume. Using this information, suppose prices are moving up on rising volume. All of a sudden, you notice an increase in selling activity. This means that investors or traders are selling their holdings to obtain profits (also known as profit taking). This situation usually lasts from one to four days, and afterward, the market will resume its original trend. If the activity goes beyond this time frame, it means that something other than profit taking is going on. If such selling goes on for weeks and even months, the market is reflecting the state of the economy, not just the state of a company or sector. In Figure 5, you can see a display of the Nasdaq 100 tracking index (QQQ), referred to as cubes, traded on the American Stock Exchange (AMEX). There was a selloff that lasted from September 2000 to April 2001. During this period, volume steadily increased as QQQ prices went down. This tells you that fear is dominating the market. This is not a pretty sight.
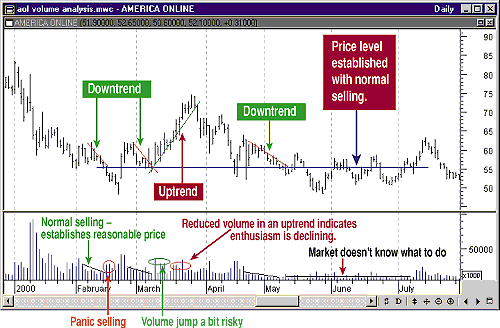
PROFIT FROM VOLUME But you don't need to lose money. By analyzing volume trends, you can actually make a profit. Pick a span of about six months. Start by looking only at volume; don't even look at price initially. Starting at the left side of a daily price and volume chart, identify periods where there are consecutive days of increasing volume (uptrend) or decreasing volume (downtrend). Don't be surprised if you find only a few such occurrences. Then look for periods where volume remained consistent. Overlay volume with a 10-day moving average of volume to confirm you have identified the volume trends. Look at the price chart. Draw trendlines on the price chart where prices correspond to volume trends. For more information on trendlines, see Working-Money.com. Extend the price trendlines to cover the entire price trend. This will illustrate that portions of a price trend are sometimes in gear with volume and sometimes are not. For example, the market will occasionally start a price downtrend in gear (that is, with falling volume) and then finish the downtrend on increasing volume, ending it with an out-of-gear move. You are trying to identify the comfort zone of the market. It's not easy to find the comfort zone for some stocks. THE COMFORT ZONE To see how price and volume can be used to identify the tops and bottoms of trends, refer to Figure 6, a display of the daily volume and price chart of America Online (AOL). The comfort zone price is the price established with normal selling; this means in-gear selling, because some prefer to think of buying and selling being accomplished in a normal fashion.
The third downtrend in April and May once again had decreasing price with decreasing volume, and it also went as low as $55. During May and June, because of the low volume, no investor could be sure what to do with AOL. What you should note from the chart is that each of the downtrends began at $63, which also happened to be the peak in July. So if you want to take advantage of these trends, watch the volume. It can tell you if price trends continue, if they remain within a price range, or if a top or bottom has been reached. SUMMARY Volume analysis is a useful technique to determine if a stock is too expensive (overvalued) or a bargain (undervalued). Investors and traders react to a bargain by buying, and as more people become aware of the bargain, both volume and price increase. A top is formed when there is either a buying frenzy or a lack of sellers (scarcity). A frenzy occurs over a few days, whereas scarcity usually takes a week or more to form a top. When a stock is too expensive, investors react by selling and eventually stop doing so because the price becomes too low (a bargain for buyers). Selling can conclude in a frenzy called a selling climax, or it can conclude with a lack of sellers. Understanding the dynamics between price and volume tells you when the price is right. Don't listen to the news. Listen to the market. Dennis Peterson may be reached at DPeterson@Traders.com. Current and past articles from Working Money, The Investors' Magazine, can be found at Working-Money.com.
Copyright © 2001 Technical Analysis, Inc. All rights reserved. |
Market index trading on a daily basis.
| Title: | Staff Writer |
| Company: | Technical Analysis, Inc. |
| Address: | 4757 California Ave SW |
| Seattle, WA 98116-4499 | |
| Phone # for sales: | 206 938 0570 |
| Fax: | 206 938 1307 |
| Website: | working-money.com |
| E-mail address: | dpeterson@traders.com |
Traders' Resource Links | |
| Charting the Stock Market: The Wyckoff Method -- Books | |
| Working-Money.com -- Online Trading Services | |
| Traders.com Advantage -- Online Trading Services | |
| Technical Analysis of Stocks & Commodities -- Publications and Newsletters | |
| Working Money, at Working-Money.com -- Publications and Newsletters | |
| Traders.com Advantage -- Publications and Newsletters | |
| Professional Traders Starter Kit -- Software | |
PRINT THIS ARTICLE

Request Information From Our Sponsors
- StockCharts.com, Inc.
- Candle Patterns
- Candlestick Charting Explained
- Intermarket Technical Analysis
- John Murphy on Chart Analysis
- John Murphy's Chart Pattern Recognition
- John Murphy's Market Message
- MurphyExplainsMarketAnalysis-Intermarket Analysis
- MurphyExplainsMarketAnalysis-Visual Analysis
- StockCharts.com
- Technical Analysis of the Financial Markets
- The Visual Investor
- VectorVest, Inc.
- Executive Premier Workshop
- One-Day Options Course
- OptionsPro
- Retirement Income Workshop
- Sure-Fire Trading Systems (VectorVest, Inc.)
- Trading as a Business Workshop
- VectorVest 7 EOD
- VectorVest 7 RealTime/IntraDay
- VectorVest AutoTester
- VectorVest Educational Services
- VectorVest OnLine
- VectorVest Options Analyzer
- VectorVest ProGraphics v6.0
- VectorVest ProTrader 7
- VectorVest RealTime Derby Tool
- VectorVest Simulator
- VectorVest Variator
- VectorVest Watchdog

