HOT TOPICS LIST
- Strategies
- Stocks
- Buy
- Investing
- Brokers
- Psychology
- Interviews
- Accumulate
- Sell
- Hold
- Spotlight
- Websites
- Candlestick Corner
- Gold & Metals
- Options Trading
LIST OF TOPICS
SECTOR INVESTING
Little Steps = Big Returns
07/27/01 04:17:20 PM PSTby Paul Merriman
Increase your profits by investing in specific sectors of the market.
"Don't put all your eggs in one basket" is frequently given advice. In the investment world, this truism is about the risk of investing exclusively in one kind of financial product. But it refers to more than just investing among different asset classes such as stocks, bonds, and cash. Two of the most common methods of slicing and dicing the market are based on the size of the company (small-cap, mid-cap, or large-cap) and its popularity (growth means popular and pricey, value means unpopular companies at supposedly bargain prices). Another way to diversify is to divide the market along industry lines or sectors by investing in sector funds or mutual funds that specialize in specific industries. THE BELLS AND WHISTLES The thinking behind investing in sector funds is simple. You invest in sector funds to seek an extra return for taking the extra risk of focusing on one sector. Not only is it a simple technique, it's also a popular one. According to data from Financial Research, a Boston consulting firm, about 21 cents of every dollar invested in mutual funds in 1999 went into sector funds, up from about 5% (5 cents?) in 1995 through 1998. Last year, the figure jumped to 33 cents. Sector investing is based on three premises:
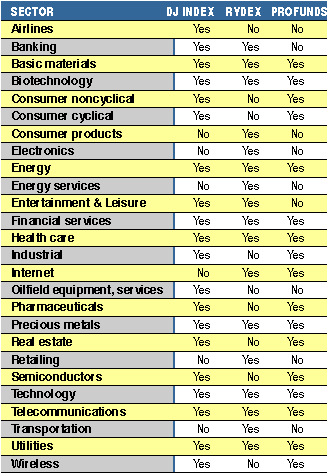
Several fund families offer good selections of sector funds, but the biggest lineups are at Fidelity Investments, Invesco Funds, Rydex Funds, and ProFunds. Fidelity offers about three dozen actively managed sector funds, the widest variety. However, the company charges a 3% front-end load on sector funds and penalizes traders by imposing an exit fee of 0.75% for sales made within 30 days of purchase. These exit fees can reduce returns to some extent. Invesco has half a dozen no-load sector funds, but the company limits trading in them to four times a year, which makes them poor choices for actively rotating in and out of sectors. Rydex offers 17 no-load sector funds and ProFunds currently offers 12 no-load sector funds; both should have 17 to 20 available by the end of 2001. Rydex and ProFunds sector funds have no trading restrictions, and neither company charges fees for either buying or selling. ProFunds' UltraSector funds are indexed and have built-in leverage of 50%. Think of leverage as borrowed capital. A leveraged fund uses risky strategies such as investing in futures and options to simulate the effect of borrowed capital. They are created with the intention of earning returns that are much higher than those of traditional mutual funds. But with the higher returns comes higher risk. To open a sector fund account, you must have at least $1,000 at Invesco, $2,500 at Fidelity, $15,000 at ProFunds, and $25,000 at Rydex. But how do you invest in sector funds? There are six basic methods. They are:
STUDYING THE SECTORS
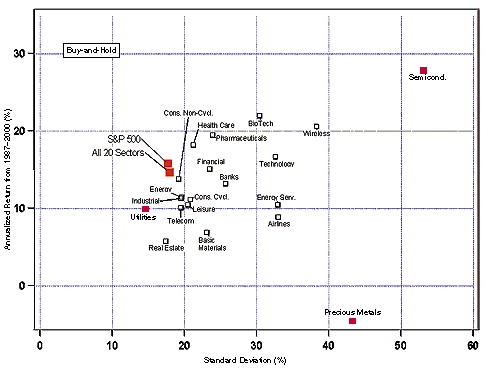
The returns among the sectors have varied widely, as indicated by Figure 2. Each small box in the graph represents one sector. The vertical location of each box in the graph indicates the compound annual return of one sector from 1987 through 2000 without any timing. The horizontal location indicates its standard deviation, a measure of risk. A sector that falls toward the top (high return) and left (low risk) is in the ideal location.
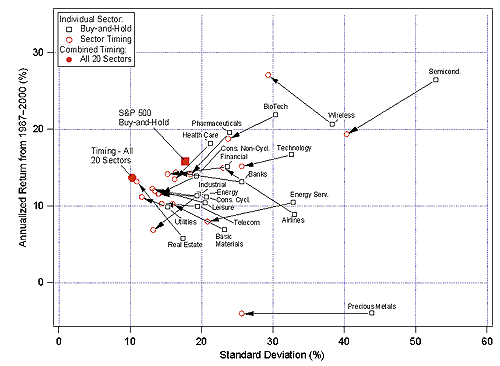
Take the time to get familiar with this graph, because it serves as a starting point in sector investing. It is created on the assumption of a buy-and-hold approach -- that is, remaining invested all the time. But sector fund investing is much more effective if you invest in the hot sectors and shun those that are cold. Of course, this means you have to time your investments. TIME THE MARKET Timing is a challenge for many investors. One simple way to apply a market timing strategy is to use a 100-day moving average. It is easy to calculate this figure by adding up the closing prices of a fund for the most-recent 100 business days and then dividing the total by 100. Whenever the price of the fund is higher than this average, you want to be invested in it. When the fund price falls below this average, you want to be out of it. See sidebar "Sector fund trading" for further explanation.
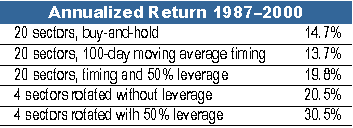
In 11 sectors, the returns were better with timing; in nine, timing resulted in lower returns. In the case of precious metals, the return was unchanged. But in every case, timing reduced the risk, and the arrows moved to the left on the graph.
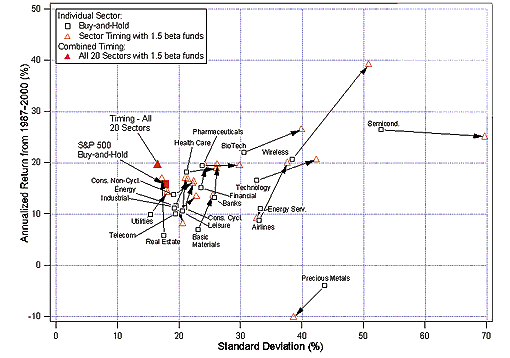
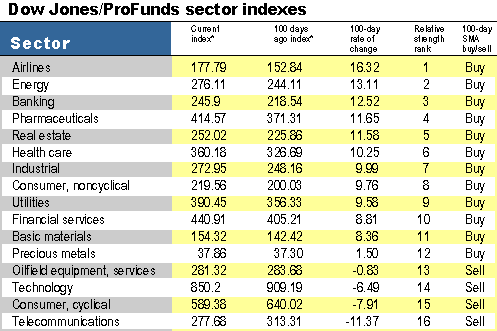
The availability of leveraged sector funds can be thought of as a major breakthrough. Leverage magnifies both the risk and the reward. Backtested studies show that timing with leverage significantly boosted the 14-year compound rate of return for all 20 sectors. For individual sectors, almost all the arrows pointed upward, indicating higher returns, and to the right, indicating higher risks. The key is to invest in the highest-performing sectors. IDENTIFY THE SECTORS There are many possible strategies for investing in sectors, but here's one that's easy to understand and calculate. This strategy identifies the four sectors that are the strongest performers at any given time so you can invest only in them. This lets you eliminate most of the market and concentrate on the sectors with the highest probability of producing short-term gains. An efficient method to identify the best sector funds is to rank all the sector funds every day, based on their 100-day relative strength. The rankings can change as often as daily, but they often persist for a month or more because the measurement period covers 100 business days -- roughly 20 weeks. All you need is a calculator and newspaper listing of fund prices. If you don't want to calculate the daily numbers, visit www.soundsectorstrategy.com, where you can find the four top sector funds updated daily. A detailed explanation of the calculation of the relative strength ranking system can be found in the sidebar. By using Rydex or ProFunds sector funds in your sector rotation strategy, you will have an excellent way to seek higher returns. Hypothetical testing shows that, with the leverage of 1.5 beta? sector funds such as those of ProFunds, this strategy would have achieved a compound rate of return in excess of 29% over the 14-year period of 1987 through 2000. (For more information on beta, see the article by David Penn in this issue of WM.)
THE DRAWBACKS There are drawbacks to sector rotation. Sector rotation strategies require your constant attention. You must check the funds' prices on a daily basis and actively manage the trades. Unless you keep up this discipline, you may not be able to make the required trades. When this happens, you will have no reasonable expectation of achieving the otherwise expected results. In addition, you may second-guess mechanical trading recommendations. This is usually counterproductive and will seriously skew the results of a disciplined trading system. Because of these drawbacks, many may fail to capture the full potential of sector funds. There is no question that the most effective way to invest in sectors is through a strict discipline of timing and rotation. The most reliable way to do that is to hire a manager who will make all the trades at the appropriate time. BIG RETURNS, SMALL STEPS In the past, sector investing has created the opportunity for extraordinary returns, and it is likely to continue to offer big returns to investors who are willing to follow little steps. The catch -- if there is one -- is that these many steps must be patiently followed. WHERE TO BUY SECTOR FUNDS
SUGGESTED READING Huebotter, Paul and Carole [1997]. OThe Fundamentals Of Sector Rotation,O Technical Analysis of STOCKS & COMMODITIES, Volume 15: February. SIDEBAR: SECTOR FUND TRADING WITH A 100-DAY MOVING AVERAGE AND A 100-DAY RATE-OF-CHANGE Step 1 For each sector, calculate the 100-day moving average: Step 2 For each sector, determine if it has a buy or sell rating: Step 3 For each sector, calculate the 100-day rate of change:
Step 4 Rank the funds from the highest rate of change to the lowest. (See sidebar Figure 1.) Step 5 Purchase or hold the four highest-ranked funds that have buy ratings.
Current and past articles from Working Money, The Investors' Magazine, can be found at Working-Money.com.
Copyright © 2001 Technical Analysis, Inc. All rights reserved. |
| Title: | President |
| Company: | Merriman Capital Management |
| Address: | 1200 Westlake AVE North, Suite 700 |
| Seattle, WA 98109 | |
| Phone # for sales: | 206-285-8877 |
| Fax: | 206-286-2079 |
| Website: | www.paulmerriman.com |
| E-mail address: | info@merrimancapital.com |
Traders' Resource Links | |
PRINT THIS ARTICLE

Request Information From Our Sponsors
- StockCharts.com, Inc.
- Candle Patterns
- Candlestick Charting Explained
- Intermarket Technical Analysis
- John Murphy on Chart Analysis
- John Murphy's Chart Pattern Recognition
- John Murphy's Market Message
- MurphyExplainsMarketAnalysis-Intermarket Analysis
- MurphyExplainsMarketAnalysis-Visual Analysis
- StockCharts.com
- Technical Analysis of the Financial Markets
- The Visual Investor
- VectorVest, Inc.
- Executive Premier Workshop
- One-Day Options Course
- OptionsPro
- Retirement Income Workshop
- Sure-Fire Trading Systems (VectorVest, Inc.)
- Trading as a Business Workshop
- VectorVest 7 EOD
- VectorVest 7 RealTime/IntraDay
- VectorVest AutoTester
- VectorVest Educational Services
- VectorVest OnLine
- VectorVest Options Analyzer
- VectorVest ProGraphics v6.0
- VectorVest ProTrader 7
- VectorVest RealTime Derby Tool
- VectorVest Simulator
- VectorVest Variator
- VectorVest Watchdog

