HOT TOPICS LIST
- Strategies
- Stocks
- Buy
- Investing
- Brokers
- Psychology
- Interviews
- Accumulate
- Sell
- Hold
- Spotlight
- Websites
- Candlestick Corner
- Gold & Metals
- Options Trading
LIST OF TOPICS
MUTUAL FUNDS
Plump Up Your Portfolio
07/28/01 11:35:28 AM PSTby Jon Quigley
Enhance your portfolio returns by knowing -- and exploiting -- different investment styles.
When you select a mutual fund, or any investment for that matter, you're indirectly selecting an investment philosophy or style. Large cap, small cap, value, and growth styles play a significant role when it comes to building your portfolio. Each of these styles has different risk-return characteristics. When you create a portfolio or reallocate your assets, it's a good idea to know what each style offers. INTRODUCTION TO STYLES The investment style concept didn't coalesce until the 1970s, when computers made it easier to compare investment managers. Consultants charged with finding investment managers for large pension plans began to notice clusters of portfolios with similar performance characteristics. These performance clusters resulted from managers sharing similar ideas about what makes a good investment. An investment style, then, is a philosophy shared by a group of investors. There are four prominent investment styles:
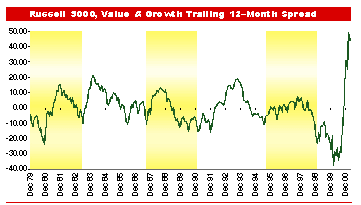
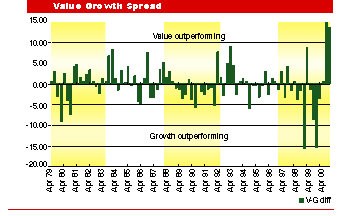
GROWTH VS VALUE The Frank Russell Co. has created several indices to measure stock market performance. To analyze the spreads or differences in returns between growth and value stocks, I analyzed stocks in the Russell 3000, an index that measures the performance of the largest US companies based on market capitalization. The results can be seen in Figures 1 and 2.
FIGURE 1: Sometimes, value outperforms growth; sometimes, growth outperforms value.
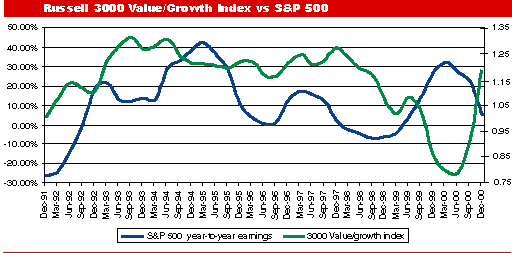
FIGURE 2: Value/growth spread from April 1979 ? April 2000. Value and growth stocks behave differently. At times, value stocks outperform growth stocks, and at other times, growth stocks outperform value. Value outperformed growth between 1981 and 1982, 1983 and 1985, 1987 and 1989, 1992 and 1994, and from the end of 2000 to the present. It's important to understand why value investing and growth investing outperform when they do, and then to learn how best to take advantage of this outperformance when it occurs. WHAT AFFECTS GROWTH AND VALUE PERFORMANCE? When you invest in the stock market, what you're essentially doing is buying and selling the company's potential for growth in profitability -- that is, its earnings. This growth potential is the underlying factor behind stock price performance and return on investment. You value a company by calculating its expected earnings and then adjusting that earnings stream back into today's dollars. The overall abundance or scarcity of earnings in the stock market appears to have an impact on the relative performance of growth and value funds. As earnings growth becomes more scarce, growth managers tend to outperform value managers. Figure 3 illustrates the high correlation of the Russell 3000 Value/Growth Indices' relative performance and the earnings momentum of the S&P 500 from 1991 to mid-1999. Clearly, that relationship has not held during the massive correction in technology stocks. However, the concept behind the factor remains logical, and it is likely to become an effective indicator again. Stocks that can either sustain or increase their earnings growth during periods when earnings growth is scarce will be priced higher. This doesn't mean that demand for earnings growth has changed; it just means that earnings are now in short supply, hence making growth stocks more valuable. As earnings growth becomes more abundant, value managers tend to outperform. Again, demand for earnings growth has not changed, but it is in more abundant supply. Why pay more for certain stocks when we can buy earnings growth more cheaply by purchasing value stocks?
FIGURE 3: This chart illustrates the high correlation of the Russell 3000 In addition to earnings momentum, we can look at corporate profit margins from another angle -- the difference between wages and inflation, referred to as the wage burden. How much of the rise in wages can companies currently pass on to consumers in the form of higher prices? If wage growth is outstripping inflation, profit margins may be under pressure, so we might expect growth stocks to outperform value stocks.
Interest rates also influence the relative performance of stocks. The yield curve (the difference between short-term interest rates such as the two-year Treasury note and long-term interest rates such as the 10-year Treasury bond) contains information about the future direction of the economy. When short-term rates are higher than long-term rates (inverted yield curve), you can anticipate a poorer economic environment ahead. This type of situation can occur when the Federal Reserve raises short-term interest rates because of the fear of inflation, or it could be due to an increase in investments in long-term bonds. This will mean scarce earnings growth, and hence a shift into growth stocks is likely. Conversely, when short-term rates are lower than long-term rates, it is an indication that the economy may be recovering. Earnings growth should be more abundant and a shift into value stocks should be profitable. General market conditions such as earnings momentum, inflation, and interest rates affect the performance of growth and value stocks and funds. Monitoring the general economic environment can give you valuable clues as to which investment style is likely to outperform in the short term. LARGE VS. SMALL In addition to growth and value, you also need to consider the difference in performance between large and small caps. The well-publicized study in 1976 by Roger Ibbotson and Rex Sinquefield on the performance of small-cap stocks shows that over the long term, small-cap stocks have outperformed large-cap stocks. This may be due to the more volatile nature of small-cap stocks. However, investors are also keenly aware of the cyclical nature of the relative performance of small caps versus large caps. Small-cap stocks have rebounded after badly trailing large caps in the late 1990s. A $1 investment in the Ibbotson Small Stock index in 1926 would have been worth $2,757 by the end of 1993. The same dollar invested in the S&P 500 would have been worth $800. From 1994 through 1999, however, large caps returned 246% versus a more pedestrian 112% for small caps. You would still be ahead if you had invested that dollar in 1926; but if you had invested in small caps in 1994, you might be kicking yourself. Despite periods such as 1994 through 1999 when large caps produced significantly higher returns than small caps, there are several reasons why small caps may still be an important supplement to your investment plan:
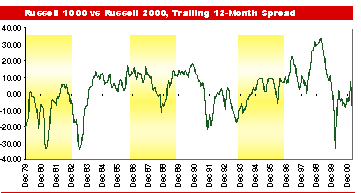
FIGURE 4: At times, large caps perform better than small caps; other times,
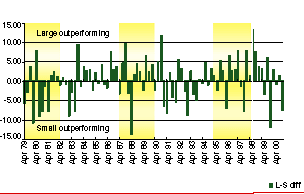
FIGURE 5: Large-cap vs. small-cap spread from April 1979-April 2000.
The charts displayed in Figures 4 and 5 show the 12-month spread between large- and small-cap stocks. I looked at the difference between the Russell 1000 index (which measures the performance of the 1,000 largest companies in the Russell 3000) and the Russell 2000 (which measures the performance of the 2,000 smallest companies in the Russell 3000). Here also, as in the case with the value and growth stocks, you can see the cyclical patterns of relative performance. WHAT AFFECTS SMALL-CAP AND LARGE-CAP RELATIVE PERFORMANCE? The perceived level of risk in the economy has an impact on the relative performance of large- and small-cap stocks. One way to measure the level of perceived risk is to observe the yield difference between lower-quality corporate bonds and higher-quality or government bonds. This difference in yields is known as the bond quality spread. Quality spreads tend to widen as investors become skeptical about the economy and future earnings growth, as well as the prospects for marginal companies. In such a situation you would be inclined to shift funds out of riskier, lower-quality corporate bonds and into higher-quality corporate or government bonds. Thus, as this bond quality spread widens, small caps (which are more speculative) tend to underperform large caps (which are more stable). During periods of rising inflation, small-cap stocks should outperform large-cap stocks. Nominal earnings are lifted across all companies in such an environment. This holds true during periods of high industrial production, which, when combined with inflation, increases nominal growth. Market volatility may also affect the relative performance of small and large caps. Small-cap stocks tend to outperform large-cap stocks during periods of decreased market volatility, since investors are willing to take on more risk. Small caps are currently in the midst of an impressive performance run. Small company stocks have been shown to trend more than the stocks of large companies. This trending behavior (persistence in prices moving higher or lower) indicates there are extended periods of time where small-cap stocks outperform their large-cap counterparts, and vice versa. CONCLUSION The trending behavior of stocks allows quantitative US equity portfolios (portfolios that allocate assets based on quantitative models) and portfolios that don't follow one of these prominent investment styles the opportunity to provide more consistent performance by overweighting small- or large-cap stocks and value or growth stocks during different points in the investment cycle. Although you may consider a long-term disciplined investing strategy to be the road to your long-term financial goals, there will be periods when a style-dependent portfolio performance may underperform the market. One alternative would be to eschew the hottest style of the moment and invest in a fund that has the latitude to shift its investment style. The hands-on approach is to study the relative performance of value versus growth stocks and large caps versus small caps. If you notice significant differences in their performance, it's likely there were significant changes in the underlying economic environment. Those who recognize these changes and rotate their investments to the style likely to outperform the market should find themselves rewarded. Jon Quigley assists in the management of all strategies at Advanced Investment Technology, Inc. (AIT). He also contributes to the ongoing research behind the firm's investment process, particularly individual factor development. Prior to joining AIT, Quigley was a portfolio manager with LBS Capital Management, where he managed global tactical asset allocation and tactical sector selection strategies. SUGGESTED READING Bernstein, Richard [1995]. Style Investing, John Wiley & Sons.
Past articles from Working Money, The Investors' Magazine, can be found at Working-Money.com.
Copyright © 2001 Technical Analysis, Inc. All rights reserved. |
Jon Quigley assists in the management of all strategies at Advanced Investment Technology, Inc. (AIT). He also contributes to the ongoing research behind the firm's investment process, particularly individual factor development. Prior to joining AIT, Quigley was a portfolio manager with LBS Capital Management, where he managed global tactical asset allocation and tactical sector selection strategies.
| Title: | CFA |
| Company: | LBS Capital Management, Inc. |
| Address: | 101 S. Old Coachman RD #610 |
| Clearwater, FL 33765 | |
| Phone # for sales: | 727-726-5656 |
Traders' Resource Links | |
PRINT THIS ARTICLE

Request Information From Our Sponsors
- StockCharts.com, Inc.
- Candle Patterns
- Candlestick Charting Explained
- Intermarket Technical Analysis
- John Murphy on Chart Analysis
- John Murphy's Chart Pattern Recognition
- John Murphy's Market Message
- MurphyExplainsMarketAnalysis-Intermarket Analysis
- MurphyExplainsMarketAnalysis-Visual Analysis
- StockCharts.com
- Technical Analysis of the Financial Markets
- The Visual Investor
- VectorVest, Inc.
- Executive Premier Workshop
- One-Day Options Course
- OptionsPro
- Retirement Income Workshop
- Sure-Fire Trading Systems (VectorVest, Inc.)
- Trading as a Business Workshop
- VectorVest 7 EOD
- VectorVest 7 RealTime/IntraDay
- VectorVest AutoTester
- VectorVest Educational Services
- VectorVest OnLine
- VectorVest Options Analyzer
- VectorVest ProGraphics v6.0
- VectorVest ProTrader 7
- VectorVest RealTime Derby Tool
- VectorVest Simulator
- VectorVest Variator
- VectorVest Watchdog

