HOT TOPICS LIST
- Strategies
- Stocks
- Buy
- Investing
- Brokers
- Psychology
- Interviews
- Accumulate
- Sell
- Hold
- Spotlight
- Websites
- Candlestick Corner
- Gold & Metals
- Options Trading
LIST OF TOPICS
INVESTING
Resistance And Support
09/28/01 12:54:17 PM PSTby Dennis D. Peterson
Do you want to profit in the market? Then you need to understand resistance and support levels.
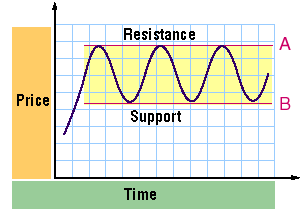
A resistance level is the ceiling price area that a stock repeatedly tries to break through above, but for reasons that will become clearer later, temporarily cannot. A support level is the counterpart to resistance, an area that a stock repeatedly tries to go below but temporarily cannot. After repeated attempts, the price will often finally rise above the resistance level or go below the support level. The most common resistance and support levels come from traders wanting to make a profit or minimize a loss. Figure 1 is an idealized chart of resistance and support levels. At price level A, the stock price hits a ceiling (resistance), preventing it from going higher. Selling occurs at level A; traders are taking a profit. Price then retreats until it hits level B (support), where buying occurs. This occurs because at that level, traders believe the stock price is too low. At that point, traders anticipate that a profit can be made.
Figure 1: Typical resistance/support area. Level A forms resistance to further price movement up, while level B forms support to further price declines. The area between resistance and support levels is also sometimes referred to as the resistance/support area. Price breaks out of this area when one of two conditions occur: first, the number of repeated attempts at overcoming resistance is greater than the attempts at breaking support (or vice versa), or second, the buyers outnumber the sellers, called an upside breakout, or the sellers outnumber the buyers, called a downside breakout. In the first instance, the number of attempts at breaking resistance or support can lead to a breakout, and in the second instance, the issue is whether the buyers or sellers will dominate. Here are examples of each:
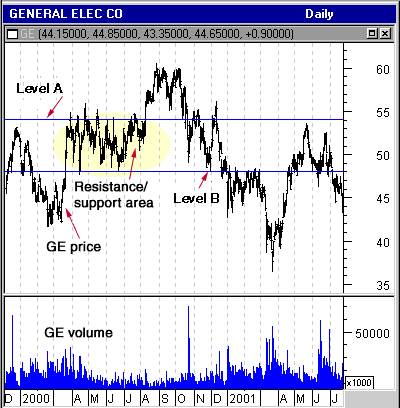
TAKE A LOOKFigure 2, the daily price and volume history of General Electric (GE), is an example of what resistance and support can look like. Line A is resistance and line B is support. From late March through late July, GE's stock price made six attempts to break through the 54.5 level. On the seventh attempt, August 9, the price finally broke through. If you examine the volume, you will find that neither buyers nor sellers dominated after the first attempt in late March to overcome resistance at 54.5. Even a cursory glance at volume suggests a lack of dominance in May, June, or July, since volume is low relative to the other time frames. Thus, Figure 2 represents an example of a number of attempts finally causing price to move beyond the resistance area.
Does the rule of thumb concerning the number of attempts always work? No. In January and February 2001, GE made several attempts to go above 48, but ultimately fell to 37.7 on March 22. What happened on that date and what does it mean? To answer these questions, you need to determine how many shares were traded (that is, volume) and the accompanying price change. And to do that, let us look at some other indicators that can shed light on price change and volume.
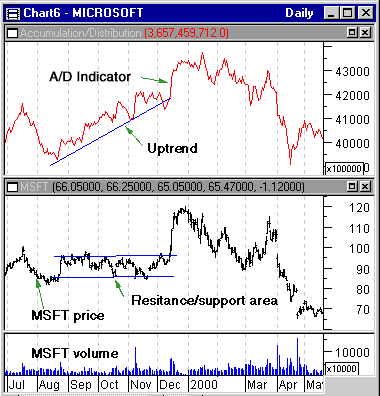
ADDITIONAL INDICATORSThere are two widely used technical indicators that combine price change and volume. Accumulation/distribution (A/D) sums up volume based on the close of the day relative to the high and low of the day. Another indicator, called on-balance volume (OBV), sums up volume based on where the close of the day compared with the close of the day before. For each indicator, a positive amount is added to the summation of the previous day's volume if price goes up and a negative amount if price goes down. The indicators increase in value when more and more traders are buying. By using these two indicators, you can gain insight into resistance/support areas. Let's look at Microsoft (MSFT) for an example of indicator use and then go back to GE. From September through November 1999, MSFT entered a resistance/support area (Figure 3). Based on the repeated attempts to break resistance, it looks like a no-brainer to predict that price will go up. But GE stock went through a similar pattern of attempts in January and February 2001, and instead of going up, price went down.
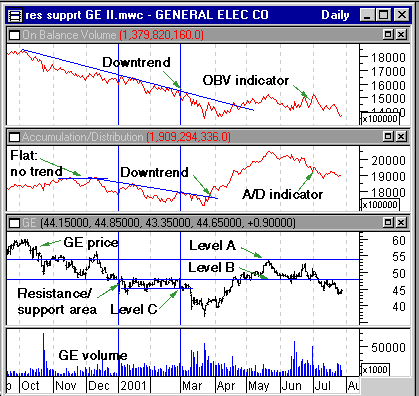
Figure 3: Microsoft Daily Price and Volume and A/D Indicator. While price stayed in a resistance/support area (middle chart: price moving up and down between parallel blue lines), Microsoft was being accumulated (top chart: A/D indicator in uptrend). The A/D indicator (Figure 3, top) shows that accumulation/distribution increased while MSFT was being traded in the resistance/support area (Figure 3, bottom). This means that while price stayed within a relatively narrow price range, traders bought more than they sold; traders were accumulating the stock. Why buy something if you think it's going down? As a rule, you don't. Thus, the majority of traders believed that MSFT was headed up. Will this give a clue into what happened to GE? I chartedGE (Figure 4) to include data up through July 2001 and have reused the same resistance/support levels (A and B) from Figure 2, but added one additional level, C. I also added both the A/D and OBV to the price and volume charts. These two indicators trend down from January through mid-March, indicating that traders were dumping GE.
Figure 4: GE Daily Price and Volume, A/D, and OBV. Both A/D and OBV were in downtrends while GE price was in a narrow price range in January and February 2001. Although A/D and OBV are related, I like to use both concurrently to make sure they confirm each other. Both are momentum indicators. There are three ways to use momentum indicators, and the most reliable is as momentum trend, which addresses whether momentum is increasing or decreasing as in, are the values of OBV or A/D rising or falling? In January and February, the trend of both A/D and OBV for GE was falling. In this case, the sellers were dominating the buyers. So what happened on March 22? On March 21, the Federal Reserve made a reduction in short-term interest rates but the market thought it was too small a cut. The market in general took a dive on March 22, and for those stocks that were already being dumped, the Fed action only compounded the selling. But given the steady decline in price and the negative trend of the A/D and OBV indicators, holding onto GE stock was ill-advised, even before the Fed acted. So OBV and A/D would have been good indicators to anticipate a price drop, right? Not always. You will find occasions when the OBV trend is up while price is in a resistance/support area, and price plummets by going below the support level. I use both A/D and OBV for confirmation; I want to see both indicators trending in the same direction. If one of them is trending and the other is not (that is, it's flat), you can still take a position but not as much or with as much certainty as if both were trending in the same direction. And the two can disagree; OBV could be trending in one direction and A/D in the opposite direction. In such cases, I stay out. One of them will be right, but why hazard a guess which one?
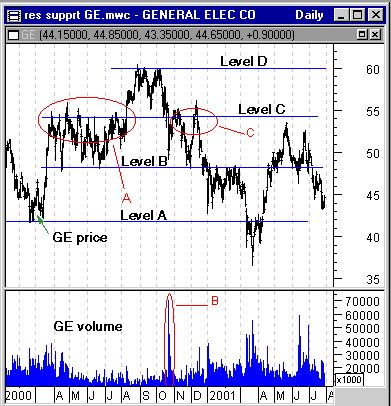
RESISTANCE = SUPPORT, AND VICE VERSAGE also exemplifies the principle that previous resistance levels become support levels and vice versa. Examining Figure 5, you can see levels A and B acting to support or resist further price changes at different times. You also know that volume is crucial in determining what direction that price will take when breaking out of resistance and support levels. Events A, B, and C (Figure 5) show how to use volume to your better advantage.
Figure 5: GE Electric Daily Price and Volume. Price resistance/support areas are delineated by levels A, B, C, and D. Events A, B, and C provide the environment for the price drop on March 22. Event A is the accumulation of GE while in the resistance/support area. The top portion of the area is emphasized in Figure 5 to highlight that buying is occurring at the top level; this is especially true in July and at the beginning of August. At event B, there is a sudden increase in volume coinciding with a significant price drop, and price fell right through support at level C. So what happened? What happened is this: If you were happily buying from March through August (event A), your profits then became endangered due to the sudden drop in prices on heavy volume (event B). After that, profit-taking and loss-minimization efforts (event C) occurred, keeping prices from exceeding level C. Now go back to Figure 4 and look at the trends of A/D and OBV during the event C time frame. OBV shows that the stock was being sold but A/D is flat. Which do you believe? You can't discount OBV's falling momentum, so if you are long you start selling at the best profit or smallest loss that you can.
SummaryA resistance level and its counterpart, a support level, both indicate the level at which the price of a stock hesitates to exceed or go below. After repeated attempts, the price will often finally rise above the resistance level or go below the support level. Price breaks out of the resistance/support area when one of two conditions occur: first, the number of repeated attempts at overcoming resistance is greater than the attempts at breaking support (or vice versa), or second, the buyers outnumber the sellers or the sellers outnumber the buyers. But the rule of thumb concerning the number of attempts doesn't always work. To get a better idea, using a technical indicator such as on-balance volume or accumulation/distribution helps gain insight into when or how support and resistance will change.
Dennis Peterson may be reached at DPeterson@Traders.com. |
Market index trading on a daily basis.
| Title: | Staff Writer |
| Company: | Technical Analysis, Inc. |
| Address: | 4757 California Ave SW |
| Seattle, WA 98116-4499 | |
| Phone # for sales: | 206 938 0570 |
| Fax: | 206 938 1307 |
| Website: | working-money.com |
| E-mail address: | dpeterson@traders.com |
Traders' Resource Links | |
| Charting the Stock Market: The Wyckoff Method -- Books | |
| Working-Money.com -- Online Trading Services | |
| Traders.com Advantage -- Online Trading Services | |
| Technical Analysis of Stocks & Commodities -- Publications and Newsletters | |
| Working Money, at Working-Money.com -- Publications and Newsletters | |
| Traders.com Advantage -- Publications and Newsletters | |
| Professional Traders Starter Kit -- Software | |
PRINT THIS ARTICLE

Request Information From Our Sponsors
- StockCharts.com, Inc.
- Candle Patterns
- Candlestick Charting Explained
- Intermarket Technical Analysis
- John Murphy on Chart Analysis
- John Murphy's Chart Pattern Recognition
- John Murphy's Market Message
- MurphyExplainsMarketAnalysis-Intermarket Analysis
- MurphyExplainsMarketAnalysis-Visual Analysis
- StockCharts.com
- Technical Analysis of the Financial Markets
- The Visual Investor
- VectorVest, Inc.
- Executive Premier Workshop
- One-Day Options Course
- OptionsPro
- Retirement Income Workshop
- Sure-Fire Trading Systems (VectorVest, Inc.)
- Trading as a Business Workshop
- VectorVest 7 EOD
- VectorVest 7 RealTime/IntraDay
- VectorVest AutoTester
- VectorVest Educational Services
- VectorVest OnLine
- VectorVest Options Analyzer
- VectorVest ProGraphics v6.0
- VectorVest ProTrader 7
- VectorVest RealTime Derby Tool
- VectorVest Simulator
- VectorVest Variator
- VectorVest Watchdog

