HOT TOPICS LIST
- Strategies
- Stocks
- Buy
- Investing
- Brokers
- Psychology
- Interviews
- Accumulate
- Sell
- Hold
- Spotlight
- Websites
- Candlestick Corner
- Gold & Metals
- Options Trading
LIST OF TOPICS
TECHNICAL ANALYSIS
Confirming Bear Markets
09/24/01 04:09:21 PM PSTby David Penn
In a down market, the only question as important as "How low will we go?" is "Will we know when we're there?"
| While many technical analysts have relegated Dow theory to that same attic in which the old tickertape machines are stashed, the underlying premise of this approach (now more than 75 years old) toward the stock markets remains both valid and potent. In fact, Dow theory can be an effective intellectual haven from the "24/7, 365" barrage of information, financial and market news reports, and analysis. Although it is true that intraday and day-to-day movements in the stock market can provide clues to entry and exit opportunities, it is equally true that a sound understanding of larger intermediate and long-term trends is key to putting any investment or trading decision in the proper context.
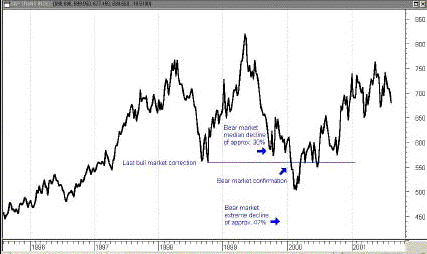
DOW THEORY ON MARKET DECLINESAs broad as the subject of Dow theory can be, I want to focus on one particular tenet: the theory of bear market confirmations. Bear market confirmations, to which I was introduced through Victor Sperandeo's Trader Vic: Methods Of A Wall Street Master, occur when the averages during a major market decline drop below the level of the previous major bull market correction. While there are various percentages and retracement levels that can be used to mathematically estimate when a bear market is "in effect," using prior price action itself as a barometer can be equally effective. Dow theorists emphasize the trough of the previous major bull market correction because, like most technical analysts, they see previous troughs as possible areas of price support. During a significant decline, if prices break down below an area established as price support during a previous significant decline, then a very bearish signal would develop. Given that prices would have already declined precipitously by that time, Dow theorists see this breakdown through previous support as an effective sign that the average has fully entered bearish territory. This is vividly displayed in the price action of the Standard & Poor's Transports Index, which reached a peak of 835 in the spring of 1999. Immediately before this peak, the S&P Transports had been in a deep correction phase (specifically, from the early summer of 1998 to the end of the year). This correction represented the last correction of the bull market, and served as the test of the bear market that the transports entered in 2000. Following the transports' peak at 835, the average sold off savagely over the second half of 1999. Often, technical analysts use a 20?30% decline as their target point from the high when classifying a market as a full-fledged bear. Other analysts use Fibonacci retracements or other mathematical strategies. The point is that a decline of anywhere from 25% to 35% from the high is commonly held to represent a bear market, and just such a point was reached in the S&P Transports in the early fall of 1999 (Figure 1).
Figure 1: S&P Transportation Index. A sharp bear market in 1999 set the stage for an 18-month bull market. Note in the chart that when the transports reached the 25-35% decline level — a bear market, as far as most analysts are concerned — they still had not declined to the level of the last major bull market correction in the middle of 1998. From the perspective of everyday technical analysis, this meant that the transports, though declining rapidly, had not yet established a long-term lower low. Such a lower low would be key for establishing, among other things, a long-term downtrend upon which to further base a bearish position. The transports, after a brief rally, resumed their descent near the end of 1999, finally breaking down beneath the low point of the last bull market correction in December. This did not represent a final bottom, however; the transports continued downward, losing another 10% before rallying in the spring of 2000.
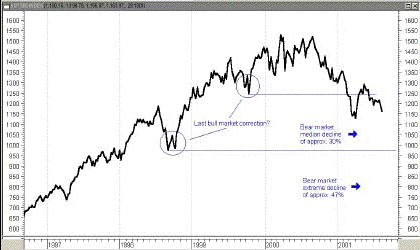
BEAR MARKETS AND THE S&P 500The price action of the transports at the end of the most recent major bull market and the beginning of a bear market is also instructive when looking at the S&P 500. Looking to see if the S&P 500 has made a bear market confirmation — in spite of the pain already endured by many investors with money-losing stock portfolios — can help determine just what stage of the bear market the major average is in. There is also the possibility of getting some insight into when this particular bear will be over. In considering the weekly S&P chart, the most immediate determination to make is when the last bull market correction in the S&P 500 occurred. This is more problematic in the S&P 500 than in the transports, but a few reasonable guesses can be made. There were two major corrections prior to the S&P bull market peak of 1550 in the spring of 2000 (ironically, immediately after the S&P Transports appeared to have bottomed). One correction is virtually identical to the correction in the transports, in the fall of 1998. However, there was a second, smaller correction in the fall of 1999 that is significant enough to be considered — even if it is rejected in the end. There are two strikes against this second correction as the last one of the bull market: first, the rally from that correction to the bull market peak in the S&P 500 is not confirmed by the transports, whereas the rally from the larger correction is confirmed by the transports. The second strike has more to do with the way the S&P 500 has performed since. If we conclude that the second, smaller correction is the last bull market correction, however, then we would have to believe that, having reached this level (1247) at the end of the year 2000, the S&P was nearing a bottom. Prices did head lower, taking off another 12%. While the transports rallied sharply from their bear market confirmation, the S&P 500 is still struggling to remain above 1200. The transports reached a bottom about one month after making a bear market confirmation and did not successfully test the level again until eight months later. If the S&P 500 acts similarly — and assuming the mid-1999 correction is the last bull market correction — then a successful rally from that level could come before the end of 2001. (See Figure 2.) Figure 2: S&P 500 Index. The 2000 bear market could fall farther before a bottom is reached.
THE LAST BULL CORRECTIONOn the other hand, if the last bull market correction was the much lower correction in 1998 (the correction that took the S&P 500 down to 972), then the S&P could be in store for a great deal more discomfort. The recent low on the S&P 500 of 1092 is still 10% above this level, which suggests that there may be more immediate declines in the S&P in order for that long-term support point to be either successfully tested or taken out. Arguably, it is the S&P 500's failure to test this level, successfully or otherwise, that has resulted in a listless market with no real buying or selling conviction. Until a major test of this area call it long-term support or the last bull market correction is conducted, there may be little serious movement in the S&P 500. Incidentally, I have also featured areas of "median" and "extreme" decline during bear markets in Figure 2. These are provided to keep the current declines in perspective, and particularly in the S&P. In the case of the transports, the bear market seemed to fit perfectly between the statistical bear market level (30% drop), the last bull market correction, and what I've called the "bear market extreme decline" level of 47%. With the S&P 500, we find the average still trading above the bear market median, the last bull market correction (the 1998 correction, not the 1999 correction), and the bear market extreme decline level. What does this all mean? It means that the S&P 500 has not yet been bearish enough compared to the historical behavior of bear markets, and compared to its own price action. Let the investor beware: There may be more downside to come.
David Penn may be reached at DPenn@Traders.com.
SUGGESTED READINGSperandeo, Victor [1991]. Trader Vic: Methods Of A Wall Street Master, John Wiley & Sons, Inc.Rhea, Robert [1962]. The Dow Theory, Rhea, Greiner & Co.
Current and past articles from Working Money, The Investors' Magazine, can be found at Working-Money.com. |
Technical Writer for Technical Analysis of STOCKS & COMMODITIES magazine, Working-Money.com, and Traders.com Advantage.
| Title: | Traders.com Technical Writer |
| Company: | Technical Analysis, Inc. |
| Address: | 4757 California Avenue SW |
| Seattle, WA 98116 | |
| Phone # for sales: | 206 938 0570 |
| Fax: | 206 938 1307 |
| Website: | www.traders.com |
| E-mail address: | DPenn@traders.com |
Traders' Resource Links | |
| Charting the Stock Market: The Wyckoff Method -- Books | |
| Working-Money.com -- Online Trading Services | |
| Traders.com Advantage -- Online Trading Services | |
| Technical Analysis of Stocks & Commodities -- Publications and Newsletters | |
| Working Money, at Working-Money.com -- Publications and Newsletters | |
| Traders.com Advantage -- Publications and Newsletters | |
| Professional Traders Starter Kit -- Software | |
PRINT THIS ARTICLE

Request Information From Our Sponsors
- StockCharts.com, Inc.
- Candle Patterns
- Candlestick Charting Explained
- Intermarket Technical Analysis
- John Murphy on Chart Analysis
- John Murphy's Chart Pattern Recognition
- John Murphy's Market Message
- MurphyExplainsMarketAnalysis-Intermarket Analysis
- MurphyExplainsMarketAnalysis-Visual Analysis
- StockCharts.com
- Technical Analysis of the Financial Markets
- The Visual Investor
- VectorVest, Inc.
- Executive Premier Workshop
- One-Day Options Course
- OptionsPro
- Retirement Income Workshop
- Sure-Fire Trading Systems (VectorVest, Inc.)
- Trading as a Business Workshop
- VectorVest 7 EOD
- VectorVest 7 RealTime/IntraDay
- VectorVest AutoTester
- VectorVest Educational Services
- VectorVest OnLine
- VectorVest Options Analyzer
- VectorVest ProGraphics v6.0
- VectorVest ProTrader 7
- VectorVest RealTime Derby Tool
- VectorVest Simulator
- VectorVest Variator
- VectorVest Watchdog


