

HOT TOPICS LIST
- Strategies
- Stocks
- Buy
- Investing
- Brokers
- Psychology
- Interviews
- Accumulate
- Sell
- Hold
- Spotlight
- Websites
- Candlestick Corner
- Gold & Metals
- Options Trading
LIST OF TOPICS
MONEY MANAGEMENT
Relative Strength Index
09/20/01 01:06:35 PM PSTby Amy Wu
As an indicator, J. Welles Wilder's relative strength index (RSI) is extremely useful in predicting tops, bottoms, and reversals, and finding support and resistance lines.
To understand the relative strength index (RSI), you need to understand momentum oscillators. Momentum oscillators measure the directional velocity of price movement. Directional velocity answers such questions as, Which way is it going? How quickly is it getting there? This may seem confusing, but think back to those old high school physics and calculus classes. What is the only thing you remember? It's probably these three words: rate of change. Really, that is all that momentum oscillators are. They are a pictorial representation of a security's rate of change. Here's an example. Suppose Janet's local grocery store is two miles away. On a Sunday afternoon, she enjoys a nice drive and arrives there within 10 minutes. But when she's in a hurry, she can make it there in four minutes. The overall distance has remained constant, but her time has shortened considerably. When Janet increases her rate of change by hurrying to the store, she increases her directional velocity, in effect. You can think of this as a rough analogy to directional velocity. When securities experience a price movement, the rate of change tells you how much of an increase or decrease in price (in Janet's case, distance) has occurred over a given time period (intraday, weekly). If the calculus is coming back to you, you'll also recognize this as the first derivative of a function. When you see the momentum oscillator on a chart, remember these two things: the slope of the oscillator is proportional to the velocity of the price movement, and the distance of the oscillator (how much it travels up or down) is proportional to the magnitude of the move. Let's imagine that security XYZ has a sudden rally and the price shoots up. The oscillator will have a steep, positive slope. But what happens if the incremental changes are equal? Then the rate of change is constant and the oscillator will be a horizontal line. Momentum oscillators, because they are a measure of rate of change, can anticipate major price movements. Using momentum oscillators keeps traders one step ahead, because oscillators can show when a stock is bottoming, or when a trend reversal is about to occur.
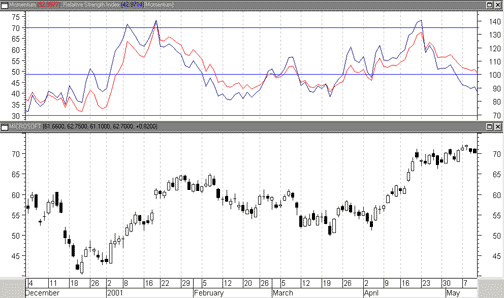
RELATIVE STRENGTHUnfortunately, momentum oscillators are not free from error. Depending on the way you configure time intervals or cutoff points, price moves can appear to be more or less significant than they really are. In addition, the type of security you are charting can strongly influence what counts as a large or small price move. Comparing price moves with a security's own history can require time-consuming calculations. This is where J. Welles Wilder's RSI comes in (Figure 1).
Figure 1: The RSI. J. Welles Wilder's RSI creates a relative scale to smooth out data and makes different pieces of data comparable to each other.
In essence, it creates a relative scale to smooth out data and makes different pieces of data comparable to each other. Perhaps it is a misnomer to call the indicator a relative strength index. The RSI compares the internal strength of measurements. It is actually the comparative strength index (CSI) that scales between securities.
USING THE RSIWilder suggested that the RSI use a lookback period of 14 days. During this time, the RSI compares the average of the up close to the average of the down close. The relative strength scale goes from zero to 100, with 100 being the maximum. If the RSI has a value of 50, that means that the average up close is identical to the average down close. Hypothetically, the maximum can be up to 100 and the minimum can go down to zero. The 30 and 70 levels, however, are the normally marked points. To use the RSI, draw horizontal lines at the 30 and 70 levels. Wilder defined these levels as market tops and bottoms, indicating the overbought and oversold points of a stock. Wilder also predicted that when the RSI goes beyond 70, a reversal or substantial reaction downward is inevitable. If, instead, the RSI drops to below 30, an upward reversal or significant reaction is imminent. The RSI comes with the following caveat: overbought and oversold conditions could be indicated even as the stock continues to advance or decline. To cross-check the RSI, stop-loss protection and confirmation from other indicators is often used. The RSI's 50 line can be used for timing. Some investors buy securities when the RSI exceeds 50, and sell securities when the RSI drops below 50. Others use the 50 line for an indication of support or resistance levels. The RSI can be calculated using the following formula:
RSI=100-(100/(1+RS)) RS=AU/AD AU=(sum up closes (last n days))/n AD=(sum down closes (last n days))/n
SUMMARYUsing the RSI in conjunction with the momentum indicator can help hedge your risks. Finding agreement between the 14-day RSI and the 14-day momentum can create a solid strategy for entering and exiting the market. This combination requires mutual agreement to enter the market; it only requires one signal to leave the market. Thanks to technical analysis software, the RSI can be computed with the click of a mouse. As always, cross-reference different indicators to check your moves. Good luck and happy investing!
Amy Wu is a student at Princeton University.
SUGGESTED READINGWilder, J. Welles [1978]. New Concepts In Technical Trading Systems, Trend Research.MetaStock (Equis International)
Current and past articles from Working Money, The Investors' Magazine, can be found at Working-Money.com. |
Amy Wu is a student at Princeton University, majoring in economics and financial engineering.
| Title: | Editorial, Intern |
| Company: | Technical Analysis, Inc. |
| Address: | 4757 California AVE SW |
| Seattle, WA 98116 | |
| Phone # for sales: | 206-938-0570 |
| Fax: | 206-938-1307 |
| Website: | www.traders.com |
| E-mail address: | AWu@traders.com |
Traders' Resource Links | |
| Charting the Stock Market: The Wyckoff Method -- Books | |
| Working-Money.com -- Online Trading Services | |
| Traders.com Advantage -- Online Trading Services | |
| Technical Analysis of Stocks & Commodities -- Publications and Newsletters | |
| Working Money, at Working-Money.com -- Publications and Newsletters | |
| Traders.com Advantage -- Publications and Newsletters | |
| Professional Traders Starter Kit -- Software | |
PRINT THIS ARTICLE

Request Information From Our Sponsors
- StockCharts.com, Inc.
- Candle Patterns
- Candlestick Charting Explained
- Intermarket Technical Analysis
- John Murphy on Chart Analysis
- John Murphy's Chart Pattern Recognition
- John Murphy's Market Message
- MurphyExplainsMarketAnalysis-Intermarket Analysis
- MurphyExplainsMarketAnalysis-Visual Analysis
- StockCharts.com
- Technical Analysis of the Financial Markets
- The Visual Investor
- VectorVest, Inc.
- Executive Premier Workshop
- One-Day Options Course
- OptionsPro
- Retirement Income Workshop
- Sure-Fire Trading Systems (VectorVest, Inc.)
- Trading as a Business Workshop
- VectorVest 7 EOD
- VectorVest 7 RealTime/IntraDay
- VectorVest AutoTester
- VectorVest Educational Services
- VectorVest OnLine
- VectorVest Options Analyzer
- VectorVest ProGraphics v6.0
- VectorVest ProTrader 7
- VectorVest RealTime Derby Tool
- VectorVest Simulator
- VectorVest Variator
- VectorVest Watchdog