HOT TOPICS LIST
- Strategies
- Stocks
- Buy
- Investing
- Brokers
- Psychology
- Interviews
- Accumulate
- Sell
- Hold
- Spotlight
- Websites
- Candlestick Corner
- Gold & Metals
- Options Trading
LIST OF TOPICS
TECHNICAL ANALYSIS
Market Breadth Or Beta?
09/26/01 10:09:32 AM PSTby Dennis D. Peterson
Breadth and beta both start with "b," but what else do they have in common? Maybe a way to help make trading decisions.
| Market breadth is a measure of market momentum. When momentum is positive and increasing, the market is bullish, and when momentum is negative and decreasing, the market is bearish. Some stocks are highly correlated with market momentum; that is, when the market is bullish, the stocks are rising, and when it is bearish, the stocks are declining. The correlation that a stock has with a market is known as its beta value. Thus, knowing how to measure market momentum is helpful in confirming the direction some stocks will take.
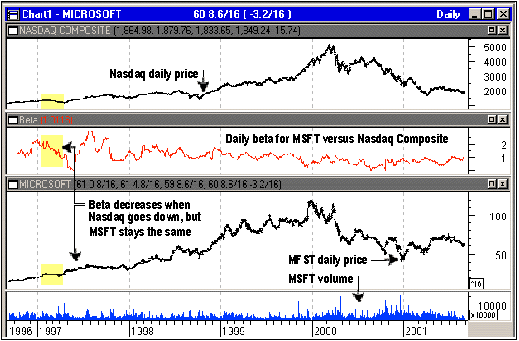
USING BETAA beta of 1.0 means the stock and the market have highly correlated trends. A stock with a beta greater than 1.0 means the stock will increase (or decrease) faster than the market. For example, Microsoft (MSFT) has a current beta of 1.0 compared to the Nasdaq Composite. But beta can change; in early 1997, MSFT was going up while the Nasdaq was going down, which drove down the beta to less than 1.0. When MSFT went up faster than the Nasdaq in the middle of 1997, its beta rose to greater than 2 (see Figure 1).
Figure 1: Msft daily price and volume history (bottom two), beta (middle chart: MSFT vs. Nasdaq), and Nasdaq Composite daily price (top chart). Beta varies, depending on the degree of synchronization of stock price movement with market price movement. Calculating beta between MSFT and the Nasdaq Composite shows that generally, MSFT moves in the same direction as the Nasdaq. Notable exceptions occurred in early 1997, when the Nasdaq went down and MSFT stayed at about the same price, producing a beta <1, and when the Nasdaq and MSFT went up in mid-1997 but MSFT went up faster, producing a beta >1.
I have a formula to calculate beta, but if you don't have the software to do a messy calculation, there is another way to get a rough estimate: chart the stock and the market, then visually compare the trends. Be aware that many sources quoting a beta value are doing so by comparing the stock to the Standard & Poor's 500, and not necessarily to the market you may have in mind.
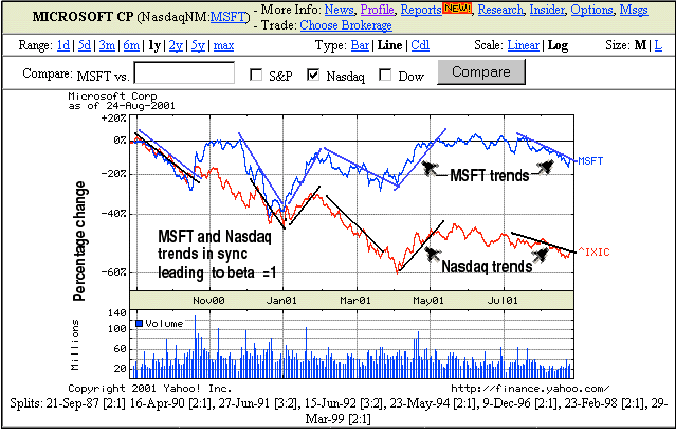
Figure 2: Comparison of Microsoft and Nasdaq Composite. The uptrends and downtrends (black bars) of the Nasdaq Composite are often matched by the trends of MSFT (purple bars). MSFT (blue lines), Nasdaq Composite (red lines), uptrends and downtrends of the Nasdaq (black bars), MSFT trends (purple bars).
If you look at a chart of MSFT (Figure 2) versus the Nasdaq Composite price history for the last year, you see that the trends of both are often matched. I have annotated the chart with the uptrends and downtrends of the Nasdaq Composite. As you can see, MSFT trends often match those of the Nasdaq. A significant aspect of MSFT price performance is that MSFT downtrends are not as severe as Nasdaq composite downtrends. MSFT does better than the composite, because there have been times that the market went down and MSFT did not, or did not go down as fast. Mutual funds can exhibit the same performance. Funds built around one particular market sector can do better than the market, or they can do worse. You want to pick a stock or fund that does better than the market, and ideally, one that performs better when the market is going down. As you can see in Figure 2, MSFT is down about 10% while the composite is down about 35%.
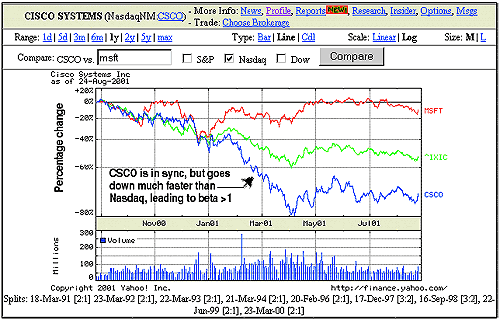
Figure 3: Comparison of Microsoft, Nasdaq Composite, and Cisco systems. CSCO downtrends were much worse than those of the Nasdaq or Microsoft, resulting in a beta greater than that of MSFT (MSFT beta=1.0, CSCO beta = 1.9).
Here's another example. CISCO Systems (CSCO) is a stock whose downside performance is worse than the market; its beta is equal to 1.9, when compared to the Nasdaq Composite (Figure 3). The major difference is in the January through April 2001 time frame, when CSCO went down much more severely than either the composite or MSFT. What you really want are separate measures of downside and upside performance that is, a negative and a positive beta. When these measures are not readily available, you can still gain some valid conclusions about upside and downside performance by looking at the charts. Knowing beta and how the equity reacts with the market changes is obviously helpful, but how do you gain insight into which way the market is going?
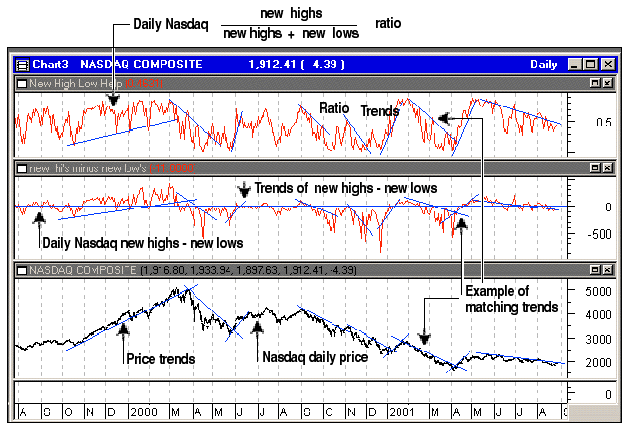
MARKET BREADTH: NEW HIGHS AND LOWSMarket breadth measures give you insight into market momentum and, consequently, direction. The measures are new highs and lows, advancing and declining stocks, and up and down volume. Each day, we calculate the number of stocks making a new high or low during the last 52 weeks; the number of stocks that advance or decline in price; and the number of shares of stock whose prices increase (up volume) and the number of shares of stock whose prices decrease (down volume). These measures are calculated for each of the major exchanges, namely the NYSE (New York Stock Exchange), Nasdaq (National Association of Securities Dealers Automatic Quotation System), and AMEX (American Stock Exchange). I will start with the new highs and lows. Two useful ways to analyze new high and low data involve calculating the daily difference of new highs minus new lows or the ratio, new highs/(new highs + new lows). When I do this and then compare the trends of either the difference or ratio to the trends of the composite, the trends often agree (Figure 4).
Figure 4: Nasdaq Composite (bottom chart), new highs-new lows (middle chart), new highs/(new highs+new lows) (top chart). Two popular ways to chart the number of new highs and new lows are to calculate the daily difference and to calculate the ratio. Either way shows trends similar to those of the Nasdaq Composite. To create a momentum indicator, I need to make comparisons over time. The easiest way is to take the difference of two moving averages, each using a different time period. I will use the differences of new highs and lows, since I can see from the chart that the trends of the difference match up more closely with the composite trends than do those of the ratio. Then I create the difference of two exponential moving averages (EMAs), one with a 12-day period and the other with a 26-day period. The formula is:
Momentum = 12-day EMA of (new highs minus lows), minus the 26-day EMA of (new highs minus new lows)
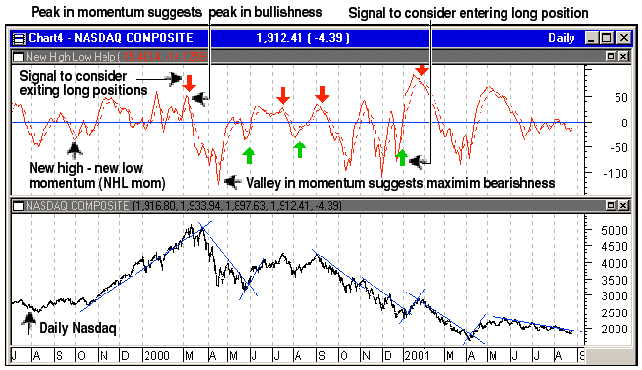
To help see when the momentum changes, I will also take the nine-day EMA of momentum. I will call the momentum together with the nine-day EMA of momentum NHLmom. Comparing the changes in price trend to the changes in momentum of the new highs and lows shows that the two are highly correlated (Figure 5). In fact, the April 2000 Nasdaq peak can be seen earlier with a downturn in new high minus low momentum.
Figure 5: Nasdaq Composite (bottom chart) and difference of 12-day and 26-day moving averages of new highs-new lows (top chart: solid line) and 9-day moving average of the difference of moving averages (top chart: dotted line). Green buy arrows are shown when the solid red line is above the dashed line, and red sell arrows when the solid red line is below the red dashed line (top chart). Examples of buy and sell show that peaks and valleys of NHLmom (top chart) correspond to turning points in the Nasdaq Composite.
If you go back to Figure 4 and look at the middle chart in the March 2000 time frame, you will see that both the difference and the ratio indicated the start of a downtrend, weeks before the price event. You could now use this NHLmom oscillator to help with trading decisions, if you make the rule that you will consider going long (Figure 5) when the momentum is above the moving average of momentum. I say "consider," because you want price to confirm the direction of the trend.
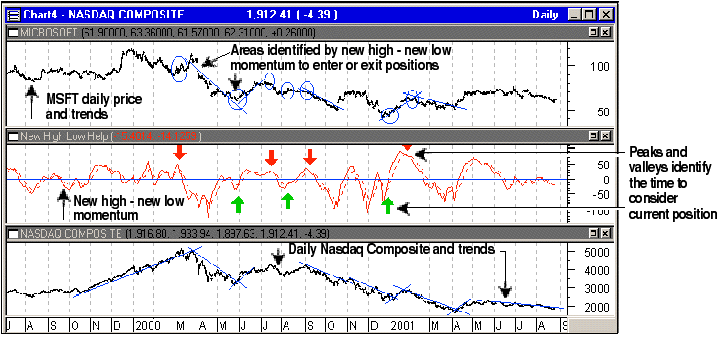
Figure 6: Nasdaq Composite (bottom chart) and Microsoft (top chart) with momentum oscillator (middle chart: NHLmom). Using buy and sell signals from the NHLmom momentum oscillator identifies critical turning points (top chart: blue circles) in MSFT. Using price to confirm direction provides a reliable signal.
If you look at MSFT and the NHLmom together, you will find that many of the turning points (Figure 6) in price are the same as when NHLmom changed. A stock like MSFT resists going down as fast as the composite, so you can be comfortable waiting for price to confirm a new trend if you are taking long positions. The moral of the story is to find a stock or mutual fund that does better on the downside than the Nasdaq Composite, and then use breadth as a setup condition to determine if it is time to get in or out of the market. Use price to confirm the trend, and then take the appropriate action. At that point, what you are basically saying is, "I know this stock often moves in the same direction as market momentum, and when I see the market getting bullish or bearish, it is time for me to consider my current position in that context."
ADVANCES/DECLINES AND UP/DOWN VOLUMEFollow the same process to use advances and declines and up and down volume. For example, the McClellan oscillator is the 19-day EMA of the difference of advances minus declines, minus the 39-day EMA of the difference of advances minus declines. Sound familiar? It should, because it is the same technique I used for highs and lows. Those who are more familiar with technical analysis will recognize that what I did was to create the moving averageconvergence/divergence (MACD) of new highs?new lows. The McClellan oscillator is built around the same approach. Analysts have observed that both the number of advancing and declining stocks and the up and down volume seem to be correlated. One attempt to combine them is the Arms index, or the trader's index (TRIN), invented by technician Richard Arms. Its goal is to show overbought and oversold conditions in the market using this formula:
Arms index = (AI/DI)/(AV/DV)
where: AI and DI = The number of advancing and declining stocks or issues AV and DV = The advancing and declining volume, the same as up and down volume
TRIN, however, has some problems as an indicator. It is bounded on upside activity, and smoothing with averages can hide results. If you rewrite the equation for TRIN, it becomes:
(AI*DV)/(DI*DV)
which reveals some of the problems. A better indicator that combines both is one devised by Tushar S. Chande, called the thrust oscillator (TO), and has the formula:
TO = (AI*AV-DI*DV)/(AI*AV+DI*DV)*100
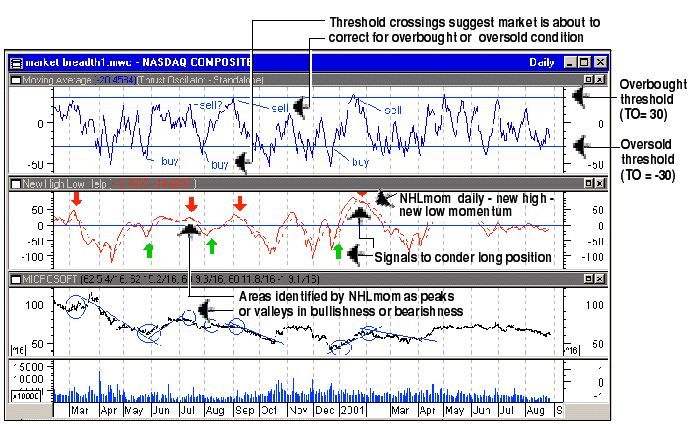
It looks similar to TRIN, but has the virtue that AI (advancing issues) is multiplied by AV (advancing volume), and that DI (down issues) is multiplied by DV (down volume). With TRIN, AI is multiplied by DV and DI multiplied by AV. TRIN is counterintuitive, while the thrust oscillator is intuitively correct because it makes more sense, for example, to multiply AI by AV as you do in the thrust oscillator rather than to multiply AI by DV as in the Arms index. If you want to use the thrust oscillator with NHLmom, then use TO as the indicator that shows whether the market is overbought or oversold. When the market is overbought, it is time to sell, and when it is oversold, it is time to buy. You can pick overbought/oversold thresholds by looking at the oscillator's past history. Because the thrust oscillator is a bit noisy, I first remove the noise by taking a 10-day simple moving average of TO. The result suggests that thresholds of +30 and -30 historically mark turning points in MSFT price action (Figure 7).
Figure 7: Microsoft daily price and volume (bottom two charts), NHLmom (middle chart), and 10-day moving average of TO (top chart). Combining the bullishness/bearishness from the NLHmom oscillator with the overbought/oversold indicator from TO generates buy and sell signals for long positions.
Now, if I combine the overbought/oversold threshold crossings with the areas previously identified as points of consideration from the bullish/bearishness oscillator NHLmom, I have a set of favorable buy/sell points (Figure 7). My analytical technique is to see where the buy/sell indicators generated by NHLmom match up with the overbought/oversold conditions of the moving average of the thrust oscillator. In many cases, what you can see is clear signals to buy and sell, besides the one I have outlined. There are some difficult decision points, one of which I have identified as "Sell?" If your entry instruction for a sell order is if MSFT moves down 5%, the decision is made. The pair of indicators suggests a buy shortly after the end of July. You would do this if price went up, confirming an upswing in price.
SUMMARYMarket breadth is a measure of market momentum, and beta is the correlation of a stock with a market. Trading decisions can be better made with the use of these two techniques; knowing how to measure market momentum is helpful in confirming market direction, and thus some stocks. That's easy enough to say, but there's more to it. You need to be aware that there is profit taking as well as bargain hunting. The stocks of choice are those with a beta nearly equal to those whose charts confirm the trend direction matching the market of your choice. Highs and lows are the means by which you tell if the market is rising or falling. Advances/declines and up/down volume indicate if the market might be overpriced or a bargain. One final caveat: Market breadth measures should be used as a condition for a trade, and only if price confirms the direction.
Dennis Peterson may be reached at DPeterson@Traders.com. |
Market index trading on a daily basis.
| Title: | Staff Writer |
| Company: | Technical Analysis, Inc. |
| Address: | 4757 California Ave SW |
| Seattle, WA 98116-4499 | |
| Phone # for sales: | 206 938 0570 |
| Fax: | 206 938 1307 |
| Website: | working-money.com |
| E-mail address: | dpeterson@traders.com |
Traders' Resource Links | |
| Charting the Stock Market: The Wyckoff Method -- Books | |
| Working-Money.com -- Online Trading Services | |
| Traders.com Advantage -- Online Trading Services | |
| Technical Analysis of Stocks & Commodities -- Publications and Newsletters | |
| Working Money, at Working-Money.com -- Publications and Newsletters | |
| Traders.com Advantage -- Publications and Newsletters | |
| Professional Traders Starter Kit -- Software | |
PRINT THIS ARTICLE

Request Information From Our Sponsors
- StockCharts.com, Inc.
- Candle Patterns
- Candlestick Charting Explained
- Intermarket Technical Analysis
- John Murphy on Chart Analysis
- John Murphy's Chart Pattern Recognition
- John Murphy's Market Message
- MurphyExplainsMarketAnalysis-Intermarket Analysis
- MurphyExplainsMarketAnalysis-Visual Analysis
- StockCharts.com
- Technical Analysis of the Financial Markets
- The Visual Investor
- VectorVest, Inc.
- Executive Premier Workshop
- One-Day Options Course
- OptionsPro
- Retirement Income Workshop
- Sure-Fire Trading Systems (VectorVest, Inc.)
- Trading as a Business Workshop
- VectorVest 7 EOD
- VectorVest 7 RealTime/IntraDay
- VectorVest AutoTester
- VectorVest Educational Services
- VectorVest OnLine
- VectorVest Options Analyzer
- VectorVest ProGraphics v6.0
- VectorVest ProTrader 7
- VectorVest RealTime Derby Tool
- VectorVest Simulator
- VectorVest Variator
- VectorVest Watchdog

