

HOT TOPICS LIST
- Strategies
- Stocks
- Buy
- Investing
- Brokers
- Psychology
- Interviews
- Accumulate
- Sell
- Hold
- Spotlight
- Websites
- Candlestick Corner
- Gold & Metals
- Options Trading
LIST OF TOPICS
MONEY MANAGEMENT
Continuation Patterns
09/25/01 10:28:21 AM PSTby Amy Wu
The rising three and falling three candlestick patterns can help you confirm trends, add to positions, and grant you a cease-fire from the battle between the bulls and the bears.
Candlestick charting extends well beyond confirming support and resistance levels and predicting market tops and bottoms. Active markets always attract traders, but sometimes recognizing market inaction is as necessary as finding activity in the market. There are times to sell, times to buy, and times to rest, and the continuation pattern recognizes those times to rest. But just because the market is resting doesn't mean you should be. Continuation patterns are an excellent way to confirm trends, add to positions, or even trade on the short side.
CANDLE BASICS REVISITEDCandlesticks, which originated in Japan several hundred years ago, are a unique and subtle way of looking at charts. Usually, we think of bars when we want a security charted. But candlesticks are only a different form of bar charts, a form that lends greater insights. The four major components of the candlestick are the open, close, high, and low of whatever tradable you are charting. A candlestick can be thought of as a vertical rectangle similar to that shown in Figure 1. If the price of the close is lower than the open, it is a black (or red) candlestick; if the price of the close is higher than the open, the candlestick is white (or green). I think of it as a Star Wars situation, with the forces of dark versus the forces of light. If a security closes higher than its open, it's considered bullish; if a security closes lower than its open, it's considered bearish. The range or difference between the close and the open will depend on the size of the body of the candle. If it is long, then the difference between the open and close is large.
Figure 1: Comparing a tick on a bar chart to a candlestick. They have all the same components, but the candlestick emphasizes the direction and depth of the opening and closing prices. Candlesticks also have thin vertical lines extending from the top and bottom of the body, like wicks. These wicks, or shadows, represent the high and the low for the day. Highs extend above the body and lows extend below the body. As with the body of the candlestick itself, longer or shorter lines show the relative difference between the high/low and open/close. There are many names for the different kinds of candlesticks. (For more information, see the suggested reading references at the end of this article.) With or without the names, however, you can intuitively see the direction of market sentiment using candlestick charting.
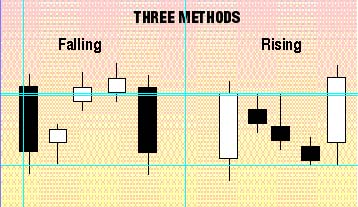
THE THREE METHODSOne major continuation pattern is called the three methods and can be classified as a rising three (bullish) or a falling three (bearish). Both signal small breaks in the trend; they do not signal a reversal. From the view of supply and demand, the three methods are spurred by uncertainty in the market. However, the market corrects itself when bulls see that a new low can't be made, or when bears see that a new high can't be made. In either scenario, the original trend continues: the bulls become bullish again, and the bears become bearish again. The three methods are related to support and resistance lines, which can often be detected by candlestick charting during an uptrend or a downtrend. But support and resistance lines can be penetrated, and the rising and falling three methods (Figure 2) are ways of confirming that the attempted penetration will fail, and that the trend will continue.
Figure 2: The three methods. Both the falling three and the rising three are continuation patterns.
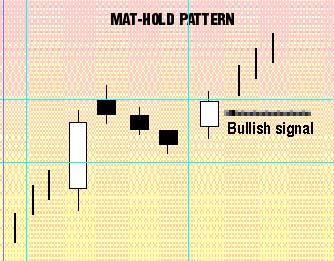
THE RISING THREEThe rising three method begins with a long white candlestick. This candlestick is representative of the current uptrend. When this candlestick is followed by a group of small-bodied candlesticks (most often three) going in the opposite direction, you will be able to see a small break in the trend. These smaller candlesticks are normally of the opposite color, black, but can also be white. For this to be a continuation pattern, these small-bodied candlesticks should be within the high%ADlow range of the first candlestick. The final candlestick of the pattern should follow the direction of the original candlestick, but they should close outside the first day's close. Classically, this pattern consists of five candles, but there is room for leeway. The pattern can have more than three small-bodied middle candles, and these reaction candles can go outside the range of the trend candles. If the candles don't tend to go in one direction, the pattern could be a mat-hold pattern (Figure 3), which is a bullish continuation pattern that allows more flexibility in the small-bodied candles.
Figure 3: Mat-hold pattern. A bullish continuation pattern that is more flexible than the three methods.
THE FALLING THREESometimes, it is confusing to remember which is the rising three method and which is the falling three. The confusion lies in the fact that the five-candle representation will have reaction candles going in the opposite direction of the candle. Remember: If a correction takes place, the name of the method refers to the trend, not the reaction candles. The two methods are the same type of patterns, only going in opposite directions. The falling three begins with a long black candlestick followed by a group of upward reaction candles. These candles all fall in range of the original candle, but are smaller-bodied. Normally, the small-bodied candles would be white (since the trend candle is black). The fifth and final candlestick is the same as the original trend candle, but in this case, it closes at a new low and opens under the close of the previous day. The only difference is that the candle will be higher or lower, depending on the trend of the original candle.
CONTINUING CANDLESTICKSRecognizing continuation patterns is important, whether you are in a long position or a short one. Besides adding positions, it also confirms your other indicators. Even if you are trading on the short side, the three methods can help you use the continuation pattern to do much more.
Amy Wu is a student at Princeton University.
SUGGESTED READINGMorris, Greg L. [1995]. Candlestick Charting Explained: Timeless Techniques For Trading Stocks And Futures, Irwin Professional Publishing.Nison, Steve [1994]. Beyond Candlesticks, John Wiley & Sons. _____ [1991]. Japanese Candlestick Charting Techniques, New York Institute of Finance/Simon & Schuster. Shimizu, Seiki [1986]. The Japanese Chart Of Charts, Probus Publishing. Yamanaka, Sharon [2001]. "Stocks And The Art Of Charts," Working Money, Volume 2: January/February.
Current and past articles from Working Money, The Investors' Magazine, can be found at Working-Money.com. |
Amy Wu is a student at Princeton University, majoring in economics and financial engineering.
| Title: | Editorial, Intern |
| Company: | Technical Analysis, Inc. |
| Address: | 4757 California AVE SW |
| Seattle, WA 98116 | |
| Phone # for sales: | 206-938-0570 |
| Fax: | 206-938-1307 |
| Website: | www.traders.com |
| E-mail address: | AWu@traders.com |
Traders' Resource Links | |
| Charting the Stock Market: The Wyckoff Method -- Books | |
| Working-Money.com -- Online Trading Services | |
| Traders.com Advantage -- Online Trading Services | |
| Technical Analysis of Stocks & Commodities -- Publications and Newsletters | |
| Working Money, at Working-Money.com -- Publications and Newsletters | |
| Traders.com Advantage -- Publications and Newsletters | |
| Professional Traders Starter Kit -- Software | |
PRINT THIS ARTICLE

Request Information From Our Sponsors
- StockCharts.com, Inc.
- Candle Patterns
- Candlestick Charting Explained
- Intermarket Technical Analysis
- John Murphy on Chart Analysis
- John Murphy's Chart Pattern Recognition
- John Murphy's Market Message
- MurphyExplainsMarketAnalysis-Intermarket Analysis
- MurphyExplainsMarketAnalysis-Visual Analysis
- StockCharts.com
- Technical Analysis of the Financial Markets
- The Visual Investor
- VectorVest, Inc.
- Executive Premier Workshop
- One-Day Options Course
- OptionsPro
- Retirement Income Workshop
- Sure-Fire Trading Systems (VectorVest, Inc.)
- Trading as a Business Workshop
- VectorVest 7 EOD
- VectorVest 7 RealTime/IntraDay
- VectorVest AutoTester
- VectorVest Educational Services
- VectorVest OnLine
- VectorVest Options Analyzer
- VectorVest ProGraphics v6.0
- VectorVest ProTrader 7
- VectorVest RealTime Derby Tool
- VectorVest Simulator
- VectorVest Variator
- VectorVest Watchdog