HOT TOPICS LIST
- Strategies
- Stocks
- Buy
- Investing
- Brokers
- Psychology
- Interviews
- Accumulate
- Sell
- Hold
- Spotlight
- Websites
- Candlestick Corner
- Gold & Metals
- Options Trading
LIST OF TOPICS
MARKET COMMENTARY
A Spring And Summer Not To Remember
09/17/01 01:08:31 PM PSTby David Penn
No one can deny that the first year of the millennium has turned out to be less than spectacular for the markets. But is it typical? First, Staff Writer David Penn looks at the first half and its lack of memorable activity, and speculates what kind of a second half could save the markets from a historic second downturn year in a row. Then he examines whether the lack of a summer rally is really all that notable.
| Is this year so different from the rest? You decide:
A FIRST HALF TO FORGETHistorically, the markets have avoided two down years in a row. What kind of second half would the markets have to have to keep that record intact? This summer, what started off with a bang quickly turned into a bust as each of the three major averages gave back January gains — and then some — in a savage spring correction.
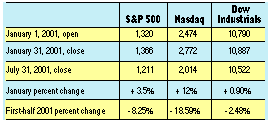
At the end of 2000, like ballplayers at the end of a losing season, investors and traders cried out "Wait 'til next year!" and turned from the wreckage of 2000 to the new year with more than the usual set of hopes and anxieties. After the high-tech lynching of technology and Internet stocks in 2000, some investors hoped that a change of millennial scenery might be just what the market ordered. Unfortunately, the first half of 2001 has proven the anxious correct. Notwithstanding the efforts of Alan "Six-Gun" Greenspan — who shot six interest rate cuts in six months at the looming recession like a cornered Ike Clanton at the OK Corral — and notwithstanding the brief bump from the January effect (the tendency of the stock market to advance in the first month of the year), each of the major averages resumed their dizzying descent in 2001. In fact, as Figures 1, 2, and 3 suggest, those who profited the most from the January advance were also the ones to suffer most for the rest of the first half of 2001.
Figure 1: January gains for the major averages turned into first-half losses by July.
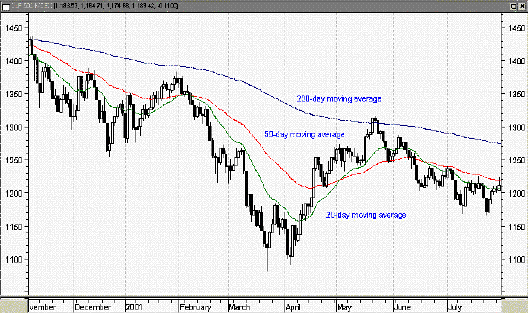
Figure 2: As strong as the April rally was in 2001, the S&P 500 still remains under its 200-day moving average.
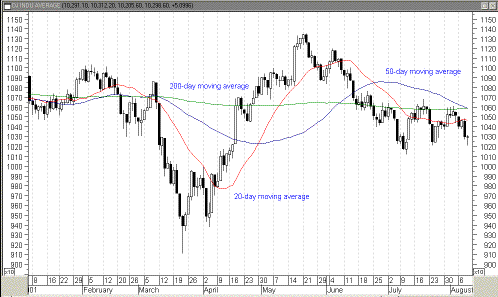
Figure 3: The Dow Jones Industrial Average remains in its neither-bull-nor-bear mode through most of the first half. It is interesting to note that the first half of 2001 continued to trace out a classic bear market breakdown. After the dizzying drop from the autumn 2000 highs — a decline that initiated the now-prevailing downtrend — the rallies in January and April proved to be the only respite from an otherwise negative market. As I have noted elsewhere ("Twenty-first Century Bear," August 16, 2001, Traders.com), it is the failure of the April rally to peak above the high of the January rally that helps confirm the bearishness of the current market. Any rebound in the second half will have the highs of April as its first, important benchmark.
A REMEMBRANCE OF SUMMERS PASTSummer rally or summer wreck? This spring, investors heartened themselves with visions of a summer rally. Unfortunately, looking back at the past 50 summers in the Standard & Poor's 500 index, we see that this year's nonexistent summer rally was more typical than tragic.Back in the spring of 2001, the rallying cry for still-desperate investors was "Just wait for the summer rally!" With little evidence supporting the possibility of significant market advances for 2001, the logic behind the notion of the summer rally grew increasingly abstract as the months wore on. First, the summer rally was to be part of the second-half recovery — which has yet to materialize. Then, as the April advance petered out, the summer rally was thought to be just on the other side of a quick, painless correction in late spring. No dice there either. Then, the hope for the summer rally moved to August, and with this latest move, it wasn't hard to see that the expectations for the summer rally were for it to arrive in the fall — assuming it arrived at all.
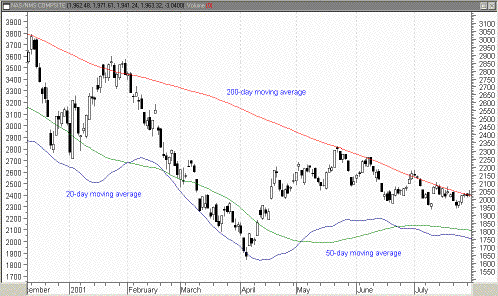
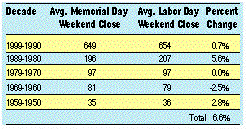
Figure 4: Whipsawing action in the Nasdaq over the summer follows steep declines. Where did this notion of a significant market move during the summer — when money managers and large-scale traders are off lounging on private beaches and in cozy hideaways — come from in the first place? While there is some suspicion that cries of "summer rally" are often invoked in the wake of inconclusive spring markets, a review of the performance of the Standard & Poor's 500 index during the summer months suggests that there is some support for the idea that the markets can advance in June, July, and August. But whether this past performance is justification for future investment planning, however, is another question entirely. I've defined "summer" as the period roughly between Memorial Day weekend and Labor Day weekend. Taking a look at the average Memorial Day close and comparing it to the average Labor Day close for each of the past five decades, I've compared summertime returns in the Standard & Poor's 500 since 1950. The results can be seen in Figure 5.
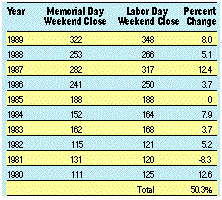
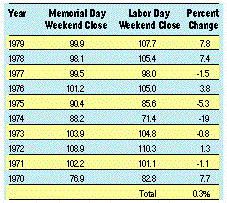
Figure 5: True advances over the summer seem to be harder to come by than often suggested. While the overall 6.6% return (over a three-month period, no less) suggests that the summer is not quite the wasteland for investing that many have described it as, it is equally clear that looking to the summer months for big gains in the market is a chancy proposition. Most of the 6.6% in summertime returns since 1950 comes from the summers of the 1980s, which on average returned 5.6%. Looking closer at the S&P 500 in the 1980s, there was only one losing summer, which was during the recession of 1981, and one flat summer in 1985. See Figure 6 for details.
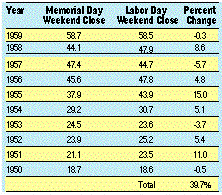
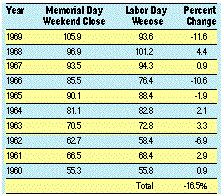
Figure 6: Were the best summers in the 1980s? A 10-year perfomance record seems to suggest so. By contrast, the 1950s, 1960s, and 1970s all featured more than four losing summers. Yet while the summers of the 1950s saw a cumulative return of 39.7%, the summers of the 1960s produced a ruinous -16.5% cumulative return. Even during the bear market of the 1970s, the summers managed to stumble into breaking even. Take a look at Figures 7, 8, and 9.
Figure 7: Big summers at the beginning, middle, and end of the decade made summer rallies a worthwhile play in the 1950s.
Figure 8: The 1960s may have featured a summer of love, but there was no love in the marketplace during the summers of that decade.
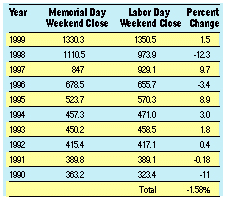
Figure 9: Strong summers at the beginning and the end of the 1970s bracketed a decade of otherwise underperforming summer seasons. While the 1990s featured only two significantly losing summers, the declines were steep enough to make summer gains rare in the last decade of the century. The 11% drop during the summer of 1990 and the 12% drop in the summer of 1998 more than negated summer gains earlier in the decade, in the summers of 1997 and 1995 (Figure 10).
Figure 10: A decade of bull markets, the 1990s featured their share of summer declines. Considered closely, the "summer rally" appears to be less reliable as predictable market behavior compared to other seasonal market moves, such as the January effect or the holiday effect (the tendency of the stock market to advancing heading into holidays and decline afterward). Whether the adage of "selling in May and going away" (going to cash during the summer with the hope of reinvesting in the fall) is the most appropriate market strategy, however, remains unclear. As the figures show, there are powerful trends of both the bullish and bearish varieties that were in evidence during some of the summers between 1950 and 2000. Perhaps at the top of that list is the 19% plunge in the S&P during the summer of 1974. But there are others that also merit mention, from the summer rallies in 1980 and 1987 to the sharp declines of 1990 and 1998. The 1980s notwithstanding, the summer rally appears to be as much a phenomenon of the financial news media as it might be a real aspect of the financial markets — at least as far as equities over the past 50 years are concerned.
David Penn may be reached at DPenn@Traders.com.
SUGGESTED READINGKaeppel, Jay [1990]. "The January Barometer: Myth And Reality," Technical Analysis of Stocks & Commodities, Volume 8: July.Kargenian, Bob [1997]. "Stock Market And Seasonality," Technical Analysis of Stocks & Commodities, Volume 15: February. _____ [1990]. "'Tis The Season," Technical Analysis of Stocks & Commodities, Volume 8: July. Merrill, Arthur A. [1991]. "The Summer Rally: Fact Or Fiction?" Technical Analysis of Stocks & Commodities, Volume 9: July. Sheimo, Michael D. [1992]. "Trading The Santa Claus Rally," Technical Analysis of Stocks & Commodities, Volume 10: December. |
Technical Writer for Technical Analysis of STOCKS & COMMODITIES magazine, Working-Money.com, and Traders.com Advantage.
| Title: | Traders.com Technical Writer |
| Company: | Technical Analysis, Inc. |
| Address: | 4757 California Avenue SW |
| Seattle, WA 98116 | |
| Phone # for sales: | 206 938 0570 |
| Fax: | 206 938 1307 |
| Website: | www.traders.com |
| E-mail address: | DPenn@traders.com |
Traders' Resource Links | |
| Charting the Stock Market: The Wyckoff Method -- Books | |
| Working-Money.com -- Online Trading Services | |
| Traders.com Advantage -- Online Trading Services | |
| Technical Analysis of Stocks & Commodities -- Publications and Newsletters | |
| Working Money, at Working-Money.com -- Publications and Newsletters | |
| Traders.com Advantage -- Publications and Newsletters | |
| Professional Traders Starter Kit -- Software | |
PRINT THIS ARTICLE

Request Information From Our Sponsors
- StockCharts.com, Inc.
- Candle Patterns
- Candlestick Charting Explained
- Intermarket Technical Analysis
- John Murphy on Chart Analysis
- John Murphy's Chart Pattern Recognition
- John Murphy's Market Message
- MurphyExplainsMarketAnalysis-Intermarket Analysis
- MurphyExplainsMarketAnalysis-Visual Analysis
- StockCharts.com
- Technical Analysis of the Financial Markets
- The Visual Investor
- VectorVest, Inc.
- Executive Premier Workshop
- One-Day Options Course
- OptionsPro
- Retirement Income Workshop
- Sure-Fire Trading Systems (VectorVest, Inc.)
- Trading as a Business Workshop
- VectorVest 7 EOD
- VectorVest 7 RealTime/IntraDay
- VectorVest AutoTester
- VectorVest Educational Services
- VectorVest OnLine
- VectorVest Options Analyzer
- VectorVest ProGraphics v6.0
- VectorVest ProTrader 7
- VectorVest RealTime Derby Tool
- VectorVest Simulator
- VectorVest Variator
- VectorVest Watchdog

