HOT TOPICS LIST
- Strategies
- Stocks
- Buy
- Investing
- Brokers
- Psychology
- Interviews
- Accumulate
- Sell
- Hold
- Spotlight
- Websites
- Candlestick Corner
- Gold & Metals
- Options Trading
LIST OF TOPICS
INVESTING
The Cold War Bear
11/01/01 01:57:07 PM PSTby David Penn
The bear market of 1962-82 kept the Dow Jones Industrial Average pinned in the triple digits for a generation of stock investors.
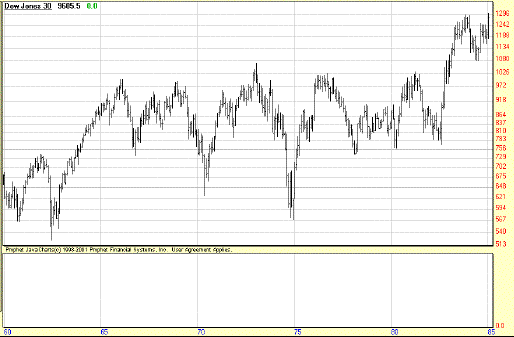
Much has been made of buying and holding stocks as a simple, long-term investment strategy. While it has become increasingly apparent that such a strategy is far from infallible, it is rarely underscored just how fallible such an approach to investing can be. Rising to prominence near the end of an epic bull market, buy and hold investing was in many ways no less a product of irrational exuberance than, say, Webvan or DrKoop.com. Any study of the equities market will reveal there is indeed a time to buy and a time to sell when it comes to stocks. As market commentator Don Luskin of The Luskin Report recently noted: "Equities are all about the upside. And when there is no upside, there's no reason to take the risk of owning equities." The bear market between 1962 and 1982 is the most recent extended period in which equities, by and large, had little upside. Had an investor purchased stocks between 1960 and 1965 and sold them within 20 years, the likelihood of realizing losses was overwhelming. Investors who bought Dow Jones Industrial Average (DJIA) stocks between 1965 and 1970 and sold within 10 years almost certainly lost money. In fact, the only class of investors who would have made money during the 1962-82 period were market timers and those invested in nonequity instruments. However, it is important to note the 1962-82 bear market was not simply a case of one towering peak, one death-defying decline, and 20 years of climbing out of the hole (as was more the case with the 1929-43 secular bear market). Instead, the 1962-82 bear market was oddly diamond-shaped (see Figure 1) and featured both lower lows (the 1966, 1970, and 1974 lows are all consecutively lower) and higher highs (the 1963, 1968, 1976, and 1981 peaks are all roughly equal, with the 1973 peak being somewhat higher). Understanding the shape that bear markets can take — especially long-term, secular bear markets — can go a long way toward helping investors understand the difficulty of profitably investing in equities during such times.
Figure 1: There and back again. The Dow Jones industrials spent 20 years trying to sustain an advance beyond Dow 1000.
CALLING A BEAR A BEARFirst, a definition of terms is in order. "Secular" means a particular market is being considered on a long-term, noncyclical basis. A secular trend would be considered the long-term or primary trend from a technical perspective. Only one stock market trend is more sizable than the secular trend — the overall 1781-to-present trend of the stock market. But there have been a number of secular trends within the market's history. In the 20th century, for example, there were five secular trends: a bull trend from about 1904 to 1929, a bear trend from 1929 to 1942, a bull trend from 1942 to 1962, a bear trend from 1962 to 1982, and a bull trend from 1982 to 2000. Within each secular trend or market, there are any number of rallies and corrections, many of which are powerfully profitable opportunities for buying and selling stocks. However, in a secular bull market, the bias of the market is upward, while in a secular bear market the bias is downward. This is not to say there are not meaningful rallies in secular bear markets, or meaningful corrections in secular bull markets; on the contrary. But what can be assured is that in the long term, rallies in secular bear markets will tend to stall when they encounter resistance, and corrections in secular bull markets will tend to stop when they encounter support. For investors, the implications should be clear. While a buy and hold investing strategy generally will meet with success in a secular bull market, such an approach is courting disaster in a secular bear market. All the dips — temporary price declines — that afford such wonderful buying opportunities in secular bull markets become quicksand when encountered in a secular bear market. In secular bear markets, those aren't dips; they're drops.
BEAR MARKETS AND COLD WAR POLITICSWhile I will not attribute the 20-year bear market in equities to the Cold War between the US and the Soviet Union (at its hottest between 1962 and 1982), the coincidence of the two is almost irresistible to observe. And the fact that the bear market began when President John F. Kennedy threw down the gauntlet to Premier Nikita Khrushchev over missiles in Cuba and ended when Ronald Reagan threatened to deploy missiles against the Soviets in Europe does make the moniker "Cold War bear" all the more appropriate. (Incidentally, I am well aware of the conventional wisdom that suggests the Cold War began with British Prime Minister Winston Churchill's "Iron Curtain" speech in 1946 and ended with the collapse of the Soviet Union in 1991. But I would still assert both events were really prologue and denouement to the epic tale that was the Cold War.) The secular bear market began with an all-time DJIA high of 740, reached in December 1961. The subsequent correction from that rally, however, was sharper and deeper than a continuation of the bull market (which had been intact since 1942) would suggest. By June 1962, the DJIA had fallen to 525, a 29% tumble from the all-time high reached less than a year before. This drop took out the previous low of 565, which was also the last trough low in the previous bull market (reached in October 1960). This action alone could have served as a bear market confirmation for Dow theorists — even though a lower low of 416 from October 1957 remained intact as support. What is most interesting about this initial decline into the bear market is how a pattern of higher (or at least equal) highs and lower lows would characterize the DJIA for the next 20 years — until the beginning of a new bull market in 1982 elevated the DJIA out of the triple digits for good. Although I suggest the secular bear market began with the DJIA high at 740 in 1961, there was one last bull run from the 1962 DJIA trough of 525 to the peak of 1000 at the beginning of 1966. Interestingly, Dow 1000, which had likely been a magnet for stock investors as the 1960s began, proved to be fairly sturdy resistance to any DJIA advance for the following 20-odd years. While horizontal resistance like this isn't necessarily typical, the 1929-43 secular bear market found resistance more on the basis of previous rallies. All five of the major rallies during the 1962-82 secular bear market (1962-66, 1966-68, 1970-73, 1974-76, and 1978-80) met resistance at or about Dow 1000.
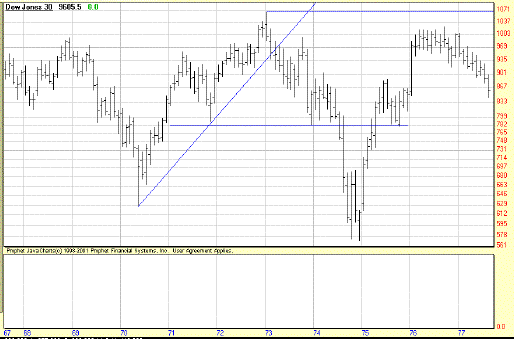
SUPPORT, RALLIES, AND RESISTANCEDow 1000 must have been a mighty psychological barrier for postwar investors; previously, stocks had been in an extended bull market ever since the recession that followed the end of World War II. As we've experienced in recent days, late-stage bull markets have an almost hypnotic lure of their own. If we could be, even momentarily, spellbound by a title like "Dow 36,000," how could postwar investors, who saw the DJIA rise from 160 in 1945 to 608 by 1959 (a 208% advance), have resisted the siren call of Dow 1000? On the downside, the last correction of the bull market bottomed at 525 in 1962, which formed a solid area of support for the DJIA for the next two decades. The sharpest decline during the 1962-82 period, the 1974 trough, successfully tested support by plunging to 570 before rallying. While a buy and hold investing strategy during this period would have likely netted investors few, if any, lasting gains, a more aggressive approach that involved getting out of the market during downturns might have fared well indeed. Many basic trend-following strategies — for example, an approach that bought strong weekly closes and sold weak or negative weekly closes (see "Market Update") — have proved successful in such periods. This is not surprising. With the exception of the choppiness of the market during the 1966-68 and 1978-80 rallies, the DJIA rebounded sharply from its lows, with clear trendline breaks often indicating a reversal in trend. (See Figures 1-2.) Savvy traders and investors, for example, would have had opportunities to escape the worst of the 1966 and 1973-74 declines simply by recognizing the DJIA's breakdown through support before the most extreme registers of these declines were reached.
Figure 2: The biggest bear. After dropping beneath a major previous rally low in 1974, the DJIA lost an additional 26% before reaching bottom.
But, it should be further noted, in the same way that not having an opinion is an opinion, buy and hold investing is an investing strategy — no more or less inherently effective than a moving average crossover strategy or a sector rotational strategy or any number of effective ways of investing or trading the market. The appeal of buy and hold investing is in its great ease, both in maintaining buy and hold style accounts as well as in the ease with which equity accounts seem to grow while buy and hold investing is championed. Unfortunately, the appearance of ease comes with a price, and that price is often significant underperformance in markets that do not involve bull trends. If, as the tendency of markets seems to suggest, bullish weeks, months, and years are likely to become more rare going forward into the 21st century, then the easy days of buy and hold investing may become equally difficult to find.
David Penn may be reached at DPenn@Traders.com.
SUGGESTED READINGPenn, David [2001]. "Market Update," Working Money, Volume 2: December.
Current and past articles from Working Money, The Investors' Magazine, can be found at Working-Money.com. |
Technical Writer for Technical Analysis of STOCKS & COMMODITIES magazine, Working-Money.com, and Traders.com Advantage.
| Title: | Traders.com Technical Writer |
| Company: | Technical Analysis, Inc. |
| Address: | 4757 California Avenue SW |
| Seattle, WA 98116 | |
| Phone # for sales: | 206 938 0570 |
| Fax: | 206 938 1307 |
| Website: | www.traders.com |
| E-mail address: | DPenn@traders.com |
Traders' Resource Links | |
| Charting the Stock Market: The Wyckoff Method -- Books | |
| Working-Money.com -- Online Trading Services | |
| Traders.com Advantage -- Online Trading Services | |
| Technical Analysis of Stocks & Commodities -- Publications and Newsletters | |
| Working Money, at Working-Money.com -- Publications and Newsletters | |
| Traders.com Advantage -- Publications and Newsletters | |
| Professional Traders Starter Kit -- Software | |
PRINT THIS ARTICLE

Request Information From Our Sponsors
- VectorVest, Inc.
- Executive Premier Workshop
- One-Day Options Course
- OptionsPro
- Retirement Income Workshop
- Sure-Fire Trading Systems (VectorVest, Inc.)
- Trading as a Business Workshop
- VectorVest 7 EOD
- VectorVest 7 RealTime/IntraDay
- VectorVest AutoTester
- VectorVest Educational Services
- VectorVest OnLine
- VectorVest Options Analyzer
- VectorVest ProGraphics v6.0
- VectorVest ProTrader 7
- VectorVest RealTime Derby Tool
- VectorVest Simulator
- VectorVest Variator
- VectorVest Watchdog
- StockCharts.com, Inc.
- Candle Patterns
- Candlestick Charting Explained
- Intermarket Technical Analysis
- John Murphy on Chart Analysis
- John Murphy's Chart Pattern Recognition
- John Murphy's Market Message
- MurphyExplainsMarketAnalysis-Intermarket Analysis
- MurphyExplainsMarketAnalysis-Visual Analysis
- StockCharts.com
- Technical Analysis of the Financial Markets
- The Visual Investor


