HOT TOPICS LIST
- Strategies
- Stocks
- Buy
- Investing
- Brokers
- Psychology
- Interviews
- Accumulate
- Sell
- Hold
- Spotlight
- Websites
- Candlestick Corner
- Gold & Metals
- Options Trading
LIST OF TOPICS
NOVICE TRADER NOTE
Novice Trader's Notebook: Bollinger Bands
10/22/01 01:28:41 PM PSTby Amy Wu
Here is another entry in our Novice Trader's Notebook, this one to explain Bollinger Bands, which are a well-used and well-loved ingredient on any market analyst's chart.
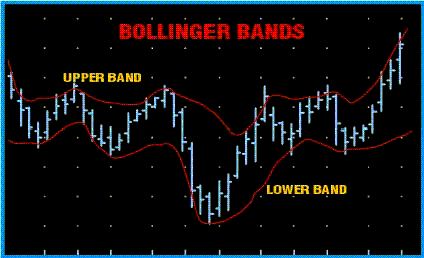
Bollinger Bands are a type of envelope analysis that uses standard deviations in calculation rather than a fixed percentage. Created by John Bollinger, the bands are displayed as upper and lower limits (derived from the security price's standard deviation). A third, middle band is a moving average, usually calculated using 20 days. Adding two standard deviations to the middle band creates the upper band. Likewise, the lower band is found by subtracting two standard deviations from the middle band.
Figure 1: Bollinger Bands. Here's an example of Bollinger Bands.
Standard deviation is a tool commonly used in statistics to find out how much a sample deviates from its mean. It is calculated by finding the n-period simple moving average of a security price (or other data), taking the sum of the squares of the difference between the data and its moving average, and then dividing this sum by n. This is called the variance. The square root of the variance is the standard deviation. To get two or three standard deviations, simply multiply that coefficient to your original standard deviation. John Bollinger placed the upper and lower bands at a distance of two standard deviations to better correct for market volatility. This differs from, for instance, moving average envelopes, in which the upper and lower bands are found by adding a fixed 3% (or any other arbitrarily fixed percentage). Using a fixed percentage does not allow for quick adjustment to periods of extreme ups and downs. Bollinger's bands, however, whose variation correlates to the standard deviation of the moving average, are more adaptable to market changes and are far better at containing prices. Thus, any price movement is far more likely to be inside the Bollinger Bands. Because the middle band is sandwiched between the upper and lower bands, this formation is referred to as "an envelope." Bollinger Bands can encompass a wider range of price movement, and thus, they are especially useful for determining whether a stock is overbought or oversold. When the price is at or above the upper band the stock may be overbought. If, however, the price is at or below the lower band the stock may be oversold. As the bands contract and expand, they may suggest the following possibilities:
To confirm your observations, John Bollinger suggests that you use his indicator in conjunction with the relative strength index (RSI). The relative strength index is known as a momentum oscillator because it measures price momentum — the velocity of price change and market speed. J. Welles Wilder, creator of the RSI, suggested that the RSI use a lookback period of 14 days. During this lookback period, the RSI compares the average of the close up to the average of the close down. The RSI is called an oscillator because it varies around the 50 line. If the RSI has a value of 50, this means that the average close up is identical to the average close down. To use the RSI, draw horizontal lines at the 70 and 30 levels. Wilder defined these levels as market tops and bottoms; thus, this indicates the overbought and oversold points of a stock. The RSI comes with the following caveat: overbought and oversold conditions could be indicated even as the stock continues to advance or decline. To ensure that the RSI is cross-checked, stop-loss protection and confirmation from other indicators are often used (and this is where Bollinger Bands come in). While there is always a chance that an indicator can fail, using indicators together can help you hedge risks and get a different perspective on the market.
Check out Traders.com for these and other Novice Trader's Notebook entries. |
Amy Wu is a student at Princeton University, majoring in economics and financial engineering.
| Title: | Editorial, Intern |
| Company: | Technical Analysis, Inc. |
| Address: | 4757 California AVE SW |
| Seattle, WA 98116 | |
| Phone # for sales: | 206-938-0570 |
| Fax: | 206-938-1307 |
| Website: | www.traders.com |
| E-mail address: | AWu@traders.com |
Traders' Resource Links | |
| Charting the Stock Market: The Wyckoff Method -- Books | |
| Working-Money.com -- Online Trading Services | |
| Traders.com Advantage -- Online Trading Services | |
| Technical Analysis of Stocks & Commodities -- Publications and Newsletters | |
| Working Money, at Working-Money.com -- Publications and Newsletters | |
| Traders.com Advantage -- Publications and Newsletters | |
| Professional Traders Starter Kit -- Software | |
PRINT THIS ARTICLE

Request Information From Our Sponsors
- StockCharts.com, Inc.
- Candle Patterns
- Candlestick Charting Explained
- Intermarket Technical Analysis
- John Murphy on Chart Analysis
- John Murphy's Chart Pattern Recognition
- John Murphy's Market Message
- MurphyExplainsMarketAnalysis-Intermarket Analysis
- MurphyExplainsMarketAnalysis-Visual Analysis
- StockCharts.com
- Technical Analysis of the Financial Markets
- The Visual Investor
- VectorVest, Inc.
- Executive Premier Workshop
- One-Day Options Course
- OptionsPro
- Retirement Income Workshop
- Sure-Fire Trading Systems (VectorVest, Inc.)
- Trading as a Business Workshop
- VectorVest 7 EOD
- VectorVest 7 RealTime/IntraDay
- VectorVest AutoTester
- VectorVest Educational Services
- VectorVest OnLine
- VectorVest Options Analyzer
- VectorVest ProGraphics v6.0
- VectorVest ProTrader 7
- VectorVest RealTime Derby Tool
- VectorVest Simulator
- VectorVest Variator
- VectorVest Watchdog

