HOT TOPICS LIST
- Strategies
- Stocks
- Buy
- Investing
- Brokers
- Psychology
- Interviews
- Accumulate
- Sell
- Hold
- Spotlight
- Websites
- Candlestick Corner
- Gold & Metals
- Options Trading
LIST OF TOPICS
TRADER'S NOTEBOOK
The Stochastic Oscillator
12/19/01 10:37:43 AM PSTby Amy Wu
Identify overbought and oversold levels with this popular indicator.
| Identifying overbought and oversold levels is a starting point in your analysis. To really understand those levels, though, you need to know how they're derived. The stochastic oscillator can do the job for you. The stochastic oscillator compares the price of a security to its price range over any time period. The stochastic oscillator is made up of two lines: %K (the primary line) and %D (the secondary line). The %K is normally depicted as a solid line; the %D is usually dashed. The %K line is the stochastic oscillator and the %D line smoothes the %K line, usually by three periods. The formula for calculating the %K line is as follows:
K = [(C - L)/(H - L)] * 100 C = Today's close
Between five and 21 periods is recommended, although n can be any number. The formula for the % D line is:
%D = 100 * (H3/L3)
INTERPRETING STOCHASTICSAccording to Steven Achelis, the following are the popular methods for interpreting the oscillator: 1 When either %K or %D falls below a specific level (usually 20) and then rises above that level, you should buy. Likewise, when the oscillator rises above a specific level (usually 80) and then falls below that level, you should sell. 2 When the %K line rises above %D line, it usually suggests an entry point, whereas when the %K line crosses below the %D line, it's considered a sell signal. 3 Divergences can also reveal much about price movements. When prices continue moving up but the stochastic oscillator doesn't, it's a negative divergence. When you see this appear, it usually means a downtrend in prices is likely. Likewise, when prices are moving down but the stochastic oscillator doesn't follow the price movement, it usually means prices will move up.
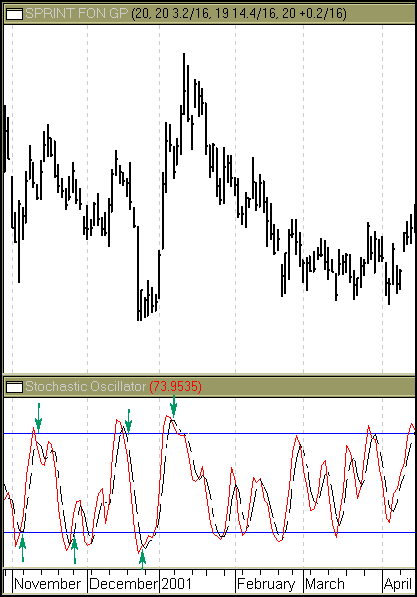
Figure 1 illustrates the signals generated by the stochastics oscillator.
Figure 1: Stochastic oscillator. Buy and sell signals are generated when the %K and %D lines cross.
SUMMARYStochastics are useful in identifying oversold and overbought levels and in determining turning points in prices. Since the value of the oscillator differs from day to day, however, it can sometimes display erratic movements, leading to false signals. Because of that, the stochastics oscillator is generally best used in conjunction with other indicators.
Amy Wu is a student at Princeton University.
SUGGESTED READINGAchelis, Steven B. [1995]. Technical Analysis From A To Z, Probus Publishing.
Current and past articles from Working Money, The Investors' Magazine, can be found at Working-Money.com. |
Amy Wu is a student at Princeton University, majoring in economics and financial engineering.
| Title: | Editorial, Intern |
| Company: | Technical Analysis, Inc. |
| Address: | 4757 California AVE SW |
| Seattle, WA 98116 | |
| Phone # for sales: | 206-938-0570 |
| Fax: | 206-938-1307 |
| Website: | www.traders.com |
| E-mail address: | AWu@traders.com |
Traders' Resource Links | |
| Charting the Stock Market: The Wyckoff Method -- Books | |
| Working-Money.com -- Online Trading Services | |
| Traders.com Advantage -- Online Trading Services | |
| Technical Analysis of Stocks & Commodities -- Publications and Newsletters | |
| Working Money, at Working-Money.com -- Publications and Newsletters | |
| Traders.com Advantage -- Publications and Newsletters | |
| Professional Traders Starter Kit -- Software | |
PRINT THIS ARTICLE

Request Information From Our Sponsors
- StockCharts.com, Inc.
- Candle Patterns
- Candlestick Charting Explained
- Intermarket Technical Analysis
- John Murphy on Chart Analysis
- John Murphy's Chart Pattern Recognition
- John Murphy's Market Message
- MurphyExplainsMarketAnalysis-Intermarket Analysis
- MurphyExplainsMarketAnalysis-Visual Analysis
- StockCharts.com
- Technical Analysis of the Financial Markets
- The Visual Investor
- VectorVest, Inc.
- Executive Premier Workshop
- One-Day Options Course
- OptionsPro
- Retirement Income Workshop
- Sure-Fire Trading Systems (VectorVest, Inc.)
- Trading as a Business Workshop
- VectorVest 7 EOD
- VectorVest 7 RealTime/IntraDay
- VectorVest AutoTester
- VectorVest Educational Services
- VectorVest OnLine
- VectorVest Options Analyzer
- VectorVest ProGraphics v6.0
- VectorVest ProTrader 7
- VectorVest RealTime Derby Tool
- VectorVest Simulator
- VectorVest Variator
- VectorVest Watchdog

