HOT TOPICS LIST
- Strategies
- Stocks
- Buy
- Investing
- Brokers
- Psychology
- Interviews
- Accumulate
- Sell
- Hold
- Spotlight
- Websites
- Candlestick Corner
- Gold & Metals
- Options Trading
LIST OF TOPICS
MARKET COMMENTARY
2001: A Stock Odyssey
11/13/01 01:51:46 PM PSTby David Penn
Looking back on a year no one, in or out of the stock market, will ever forget. Plus: what bonds can tell you about stocks.
| In 2001, the market that couldn't be stopped was not only stopped, it actually backed up several yards. While the Nasdaq began its decay early in 2000, and the Standard & Poor's 500 followed shortly thereafter with an autumn collapse, the Dow Jones Industrial Average (DJIA) held on until the spring of 2001 before tossing in the towel. The DJIA slipped down toward a four-year upward trendline at the end of 2000, but rebounded strongly in the now-forgotten April rally to establish a new all-time high in May. But the bear that brought down the DJIA's younger cousins was not of a mood to spare the DJIA. The industrial average fell below the four-year upward trend line during its consolidation period over the summer — a period that, in hindsight, looks very much like a distribution period. By late summer, however, the earnings writing was on the wall as the larger companies admitted they were having as difficult a time making money as the smaller companies were. Given the way the market entered the autumn months, it has become commonplace for market commentators to say that, the tragedy of September 11 notwithstanding, the market and the economy were already in poor shape. This is certainly true, and even if it were not the case, people could still be forgiven for the stiff-upper-lip approach of insisting that terrorism may have bent but not broken the capital markets of the US. But as the markets rallied from the steep drops that occurred once the markets reopened on September 17, the weakness of the market before September 11 seemed to be all but forgotten as the clarion call of "the bottom" began to resound once again.
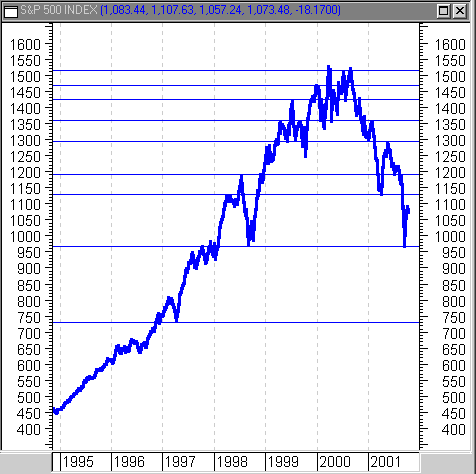
THE TROUBLE WITH RALLIESGiven the declines suffered by the major averages, it is likely we are closer to a bottom than we are to a top. The post-September 11th declines in the S&P 500, for example, took the index down to its 1998 low of about 960. This means the S&P 500 lost, at its worst, 36% of its value from the all-time peak of about 1500 in the year 2000. Compared to other major bear market declines at comparable points in their development, essentially 12 months into the decline, this is not unusual. The most vicious bear market in recent history took place in 1973, and it took 23% off of the S&P 500 from January 1973 to January 1974. The infamous Crash of 1929 saw the DJIA lose 48% from September 1929 to September 1930. In both cases, however, there were more losses to come. The 1929 bear market finally bottomed in July 1932 (another 22 months later), and the 1973 bear market ended with a bottom in October 1974 (another 10 months later). But the problem with this market may be less in finding a bottom — which will come eventually — and more in finding a reliable path back toward the top. As Figure 1 shows, the resistance the bull market left behind — previous rallies that stalled before advancing to new highs — is legion.
Figure 1: The S&P 500's seven degrees of resistance. The 1998 highs of 1200 are only one of a number of hurdles that await any S&P 500 rally.
Assuming the S&P 500 put in a bottom at 960 in mid-September, when the index found support at the midyear 1998 low, formidable resistance awaited at the 1998 highs. The 1998 highs hit about 1200, where the advance caved in the face of economic problems in Russia and Brazil. The rally that broke through resistance did so on the back of 75 basis points' worth of Fed funds rate cuts in three months that autumn. These, of course, were the last rate cuts investors would see for two years, as the Federal Reserve's now-lamentable rate-raising campaign took over. This is not to say prices will not be able to rally and take out previous highs; but the difficulty of doing so should not be underestimated. Late 1998 signaled the end of one of the most epic bull markets US equities investors have ever experienced. On the heels of a major liquidity infusion from the Fed taking the Fed funds rate from 5.25% to 4.75% in less than three months, the S&P 500 took out the all-time high at the time of 1200. If that's what it took in 1998, then investors can be forgiven for wondering just how the S&P 500 can do it now.
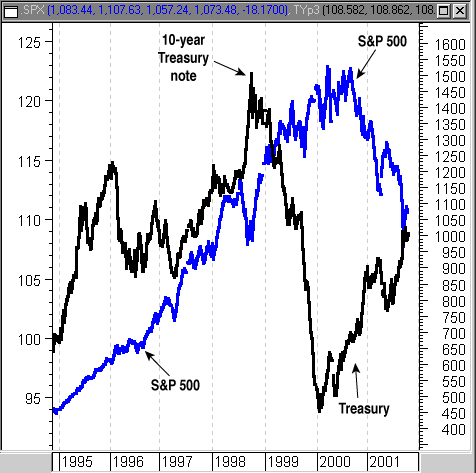
TO THE BOND BUNKERS?Pity the poor bond. Like someone with a pickup truck who only hears from his acquaintances when they are in the midst of a move, most investors pay little attention to fixed-income investments in the bond market until they feel they have to. This couldn't have been more the case in the last years of the late bull market, when even little old ladies — the patron saints of the bond market in current-day mythology — were writing books about how to make a killing on stocks like TheGlobe.com and JDS Uniphase. But there is more to bonds than their role as safe havens for stock investors burned one time too many. In fact, the relationship between bond prices and stock prices is such that equities investors can often spare themselves a great deal of pain by watching bonds before their stocks start tanking, as opposed to afterward. In Intermarket Technical Analysis, author John Murphy makes a compelling case, asserting that bond prices tend to lead stock prices both on the way up and on the way down. As far as Murphy is concerned, major breakdowns in the stock market are almost always preceded by similar breakdowns in the bond market. Although there are allowances for lead time, the relationship between bonds and stocks is such that no serious equities investor should ignore it. Murphy's classic example of the bond/stock relationship comes in his analysis of the 1987 stock market crash. He shows that after peaking in late 1985, bonds traded in a relatively high-altitude range for about a year before bond prices began to slide in late 1986. An end-of-the-year rally in 1986 slowed the bond's descent — but only for a few months at the beginning of 1987. As 1987 unfolded and the stock market continued to soar, the bond market continued to deteriorate, reaching a bottom in October 1987. It was in October 1987 that the Dow Jones industrials experienced what was at the time its biggest single-day point loss in history. More recently, the peak in the 10-year Treasury note (just one of many possible proxies for the bond market) in 1999 served as a warning to those equities investors familiar with the inverse relationship between bonds and stocks. The 10-year Treasury reached a high of almost 124 in mid-1998, and spent the next year and a half in a vertigo-inducing downtrend before reaching a bottom of 94 just in time for Y2K (see Figure 2). This decline of about 24% occurred at exactly the same time the S&P 500, for example, gained 37%. Since the bond trough/stock peak of 2000, incidentally, the 10-year Treasury has rallied 16% while the S&P 500 declined 31%.
Figure 2: The bond market peak late in 1998 and subsequent decline anticipated a similar peak and decline for stocks. How can equities investors take advantage of this relationship between stocks and bonds? Murphy suggests an analysis of the stocks/bonds relationship would allow stock market investors to limit their exposure to stocks when bond prices begin to break down, or to allow more aggressive trading-oriented investors even to consider playing stocks on the short side. What comes across most clearly from Murphy's analysis, however, is the point that all the major markets — from stocks and bonds to commodities and gold — are interrelated. Examining some of these relationships, rather than creating a more complicated picture, can actually help investors and traders better see just how their investments and positions fit in the frame.
David Penn may be reached at DPenn@Traders.com.
READING AND REFERENCEMurphy, John J. [1991]. Intermarket Technical Analysis, John Wiley & Sons.MetaStock for Windows (Equis International)
Current and past articles from Working Money, The Investors' Magazine, can be found at Working-Money.com. |
Technical Writer for Technical Analysis of STOCKS & COMMODITIES magazine, Working-Money.com, and Traders.com Advantage.
| Title: | Traders.com Technical Writer |
| Company: | Technical Analysis, Inc. |
| Address: | 4757 California Avenue SW |
| Seattle, WA 98116 | |
| Phone # for sales: | 206 938 0570 |
| Fax: | 206 938 1307 |
| Website: | www.traders.com |
| E-mail address: | DPenn@traders.com |
Traders' Resource Links | |
| Charting the Stock Market: The Wyckoff Method -- Books | |
| Working-Money.com -- Online Trading Services | |
| Traders.com Advantage -- Online Trading Services | |
| Technical Analysis of Stocks & Commodities -- Publications and Newsletters | |
| Working Money, at Working-Money.com -- Publications and Newsletters | |
| Traders.com Advantage -- Publications and Newsletters | |
| Professional Traders Starter Kit -- Software | |
PRINT THIS ARTICLE

|

Request Information From Our Sponsors
- VectorVest, Inc.
- Executive Premier Workshop
- One-Day Options Course
- OptionsPro
- Retirement Income Workshop
- Sure-Fire Trading Systems (VectorVest, Inc.)
- Trading as a Business Workshop
- VectorVest 7 EOD
- VectorVest 7 RealTime/IntraDay
- VectorVest AutoTester
- VectorVest Educational Services
- VectorVest OnLine
- VectorVest Options Analyzer
- VectorVest ProGraphics v6.0
- VectorVest ProTrader 7
- VectorVest RealTime Derby Tool
- VectorVest Simulator
- VectorVest Variator
- VectorVest Watchdog
- StockCharts.com, Inc.
- Candle Patterns
- Candlestick Charting Explained
- Intermarket Technical Analysis
- John Murphy on Chart Analysis
- John Murphy's Chart Pattern Recognition
- John Murphy's Market Message
- MurphyExplainsMarketAnalysis-Intermarket Analysis
- MurphyExplainsMarketAnalysis-Visual Analysis
- StockCharts.com
- Technical Analysis of the Financial Markets
- The Visual Investor


