

HOT TOPICS LIST
- Strategies
- Stocks
- Buy
- Investing
- Brokers
- Psychology
- Interviews
- Accumulate
- Sell
- Hold
- Spotlight
- Websites
- Candlestick Corner
- Gold & Metals
- Options Trading
LIST OF TOPICS
DOW THEORY
Confirming Averages
12/11/01 01:35:14 PM PSTby David Penn
What happens when the Dow industrials go where the transports fear to tread?
| One of the original tenets in Dow theory, and one of the most misunderstood, is the notion that the averages must confirm each other. Generally speaking, this refers to the rising and falling price action of two of the three main Dow Jones averages, the Dow Jones Transportation Average (DJTA) and the Dow Jones Industrial Average (DJIA). These averages have existed since their original inception by Charles Dow, though the actual components of the averages have changed greatly over the years as different companies rose and fell from prominence in the American marketplace. To "confirm each other," the highs and lows in one average must be matched — in relatively short order — by highs and lows in the other average. For example, if one average made a significant high, then went on to record a higher high, while the other average more or less simultaneously established a significant high but failed to follow through with a higher high, then the Dow theorist would be on the alert that the new high was perhaps suspect, and a reversal might be forthcoming. For those who have paid little attention to the DJIA — to say nothing of the DJTA — it may come as a shock to imagine these two averages, one filled with companies like McDonald's, Microsoft, and Exxon Mobil, and the other with companies like Federal Express, US Airways Group, and Roadway Express, actually moving in tandem. But the fact of the matter is they do — at least most of the time. As counterintuitive as it may seem, the true time to worry is when these averages — diverse as they may be both internally and when compared to each other — start to diverge.
EXPLAINING AVERAGESThere is a variety of explanations as to why these two averages generally move together. When Dow theory was originally developed (when the Dow transport average was referred to as the Dow railroad average), the idea that the two averages should confirm each other came from the realization that as economic activity picked up at the beginning of the business cycle, the first sector to benefit would be the transportation sector, which would be charged with delivering the increase in manufactured and agricultural goods to market. The theory goes that as economic activity increased, the industrial sector would begin to benefit from rising sales of goods and services. Toward the end of the business cycle, industrial companies would begin to pare back their orders for raw materials, and their need to ship goods to market would also weaken. This contraction of industrial activity, goes the theory, would be first felt by the transportation sector. While the components of the DJTA have changed just as significantly as those of the DJIA, the relationship between the two averages has remained remarkably consistent over the decades. And though other, complementary theories have arisen to explain the behavior of the transportation average vis-a-vis the industrials, the fundamental notion that "manufactured goods must be shipped to market" has remained a cornerstone in understanding how this aspect of Dow theory works. It is inaccurate to insist that the DJTA leads the DJIA; it is much more meaningful to say that the two averages move more or less in tandem. Nevertheless, when Dow theorists speak of confirming averages, they most often speak of the transportation average confirming the relative highs and lows of the industrials. In other words, should the industrials make a new high while the transports remain flat — or worse, head lower — Dow theorists would suggest that the new high made by the industrials was not "confirmed" by the transports, and that a reversal in the industrials might be in the making. Similarly, should the transports establish a new relative high while the industrials remain flat, Dow theorists would carefully watch the industrials for signs of impending strength. While not a fail-safe strategy — Dow theory notoriously failed to produce a buy signal after the market crash of 1987, as far as many are concerned — Dow theory does provide traders and investors with an additional tool with which to study, analyze, and understand how and when equities move the way they do.
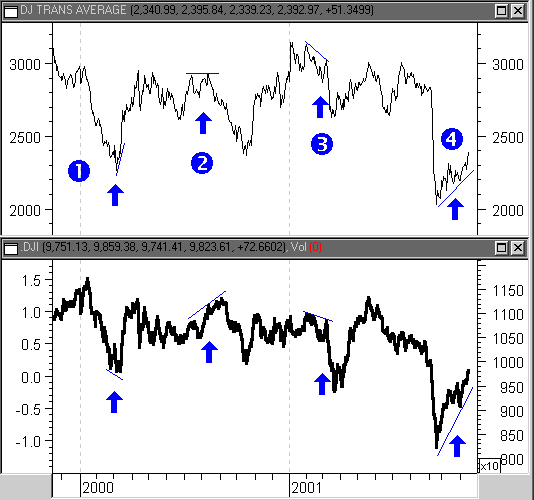
DOW THEORY 2000Figure 1 provides a look at both the DJTA and the DJIA from January 2000 to November 2001 — essentially the first two years of the current bear market. Important confirmation (and nonconfirmation) areas are noted, and provide a graphic example of confirming averages in action. The first example occurs in March 2000 when the Dow industrials, having just reached an all-time high of 11,750, plunged sharply. Note how, in March, the Dow industrials recorded two relatively equal lows while, in the same month, the Dow transports recorded a low and then a somewhat higher low. In this instance, the second low in the Dow industrials was not confirmed by the price action of the Dow transports. A Dow theorist, then, might speculate that the Dow industrials had bottomed for the time being, and open a long position. In this case, we are able to see such a position might have been well rewarded, as the DJIA rallied 17% by April.
Figure 1: Confirmation and nonconfirmation between the Dow transports and the industrials.
The second example takes place during the summer of 2000. As the Dow industrials began to rally in July and August, the Dow transports remained noncommittal. While the August high in the industrials is higher than the July high, both the August and July highs in the transports were virtually equal. The transports refused to confirm the high established by the industrials in August. Dow theorists would likely have interpreted this as a sign of weakness in the industrials' rally and a time, perhaps, for greater caution where equities were concerned. Sure enough, the Dow industrials began to decay in August, eventually losing 13% before finding a bottom at approximately Dow 10,000. A third example can be found in the first quarter of 2001. Both averages entered the year in trading ranges, though the transports seemed to be putting in a series of subtly lower highs at the beginnings of January, February, and March. The simultaneous highs in the industrials had some variation, the February high being slightly higher than the January and March highs, but to all appearances, the industrials' highs were comparable. The big break came early in March, when the transports noted a significantly lower high compared to those at the beginnings of January and February. At the same time, the industrials had marked a high that was lower than the February high, yet virtually equal to the January high. Such a scenario in the industrials might have inspired little more than trading paralysis, given the inconclusiveness of the industrials' price action taken alone. However, when considered along with the obviously weakening situation in the transports, the likelihood of a breakdown in the industrials became all the more probable. That breakdown, in fact, did occur within the first week of March, as the Dow Industrials lost 16% of their value by the middle of the month.
DOW AND THENWhat does the theory of confirming averages tell us about recent, post-September 11th advances in both the Dow industrials and the transports, if anything? So far, the DJTA seem to be embracing the rally fully, with both averages continuing — at least, as of mid-November — to make new short-term highs. Unfortunately, there is not much more the theory of confirming averages can tell us about the current rally. There is no sense of duration that can be provided from the transports' confirmation of the industrials' series of new short-term highs; indeed, for a trader seeking to take advantage of the trend, there is nothing in the transports to be dissuaded from a long position in the Dow industrials at this time. Some critics of Dow theory in general and the notion of confirming averages in specific note that this approach tends to lag significantly behind price action in the averages. This, they suggest, makes Dow theory late at best and fundamentally unreliable at worst. However, for all but the most short-term of traders, this lag provides time for the averages to make more (or less) meaningful moves. For example, the industrials moved to establish a mid-November high at a time when the transports had yet to match its own autumn high. At that point, it could have been argued that the transports had not yet confirmed the industrials' new high. That confirmation, however, came relatively shortly thereafter (although it could be argued that the allegedly accidental crash of an airplane in the New York area just two months after the terrorist attacks on the World Trade Center and the Pentagon is partly to blame for the transports' sluggishness). Perhaps, when it comes to Dow theory, one trader's lag is another trader's (profitable) exercise in patience.
David Penn may be reached at DPenn@Traders.com.
Current and past articles from Working Money, The Investors' Magazine, may be found at Working-Money.com. |
Technical Writer for Technical Analysis of STOCKS & COMMODITIES magazine, Working-Money.com, and Traders.com Advantage.
| Title: | Traders.com Technical Writer |
| Company: | Technical Analysis, Inc. |
| Address: | 4757 California Avenue SW |
| Seattle, WA 98116 | |
| Phone # for sales: | 206 938 0570 |
| Fax: | 206 938 1307 |
| Website: | www.traders.com |
| E-mail address: | DPenn@traders.com |
Traders' Resource Links | |
| Charting the Stock Market: The Wyckoff Method -- Books | |
| Working-Money.com -- Online Trading Services | |
| Traders.com Advantage -- Online Trading Services | |
| Technical Analysis of Stocks & Commodities -- Publications and Newsletters | |
| Working Money, at Working-Money.com -- Publications and Newsletters | |
| Traders.com Advantage -- Publications and Newsletters | |
| Professional Traders Starter Kit -- Software | |
PRINT THIS ARTICLE

Request Information From Our Sponsors
- StockCharts.com, Inc.
- Candle Patterns
- Candlestick Charting Explained
- Intermarket Technical Analysis
- John Murphy on Chart Analysis
- John Murphy's Chart Pattern Recognition
- John Murphy's Market Message
- MurphyExplainsMarketAnalysis-Intermarket Analysis
- MurphyExplainsMarketAnalysis-Visual Analysis
- StockCharts.com
- Technical Analysis of the Financial Markets
- The Visual Investor
- VectorVest, Inc.
- Executive Premier Workshop
- One-Day Options Course
- OptionsPro
- Retirement Income Workshop
- Sure-Fire Trading Systems (VectorVest, Inc.)
- Trading as a Business Workshop
- VectorVest 7 EOD
- VectorVest 7 RealTime/IntraDay
- VectorVest AutoTester
- VectorVest Educational Services
- VectorVest OnLine
- VectorVest Options Analyzer
- VectorVest ProGraphics v6.0
- VectorVest ProTrader 7
- VectorVest RealTime Derby Tool
- VectorVest Simulator
- VectorVest Variator
- VectorVest Watchdog