HOT TOPICS LIST
- Strategies
- Stocks
- Buy
- Investing
- Brokers
- Psychology
- Interviews
- Accumulate
- Sell
- Hold
- Spotlight
- Websites
- Candlestick Corner
- Gold & Metals
- Options Trading
LIST OF TOPICS
MARKET UPDATE
Value vs. Growth 2001
12/21/01 01:19:28 PM PSTby David Penn
Value season? Growth season? In 2001, it was hard to tell the difference. Plus: Will gold glitter once again?
| Conventional wisdom suggests that when the going gets rough, value stocks are the place to be. These often overlooked and underappreciated equity gems, which nobody cares about when the market is all raging bull, tend to outperform their growth stock brethren once the averages start pointing down. At the same time, a Standard & Poor's 500 down 37% from its all-time high and a Nasdaq down an amazing 70% from its all-time high have meant that the majority of growth stocks are now trading for fractions of their prebear market value. This, of course, has investors salivating at the opportunity to buy shares of stock like Oracle, Amazon.com, Dell, and Cisco at what would have been considered outrageously low prices just a year ago. So perhaps scooping up cheap — as in inexpensive — former growth leaders combines the best of both the value and growth worlds. Unfortunately, no conventional growth/value roadmap would have proved very helpful for investors in 2001. Although there were better and worse places to invest as far as the growth/value categories were concerned, neither could avoid the misery that befell equities.
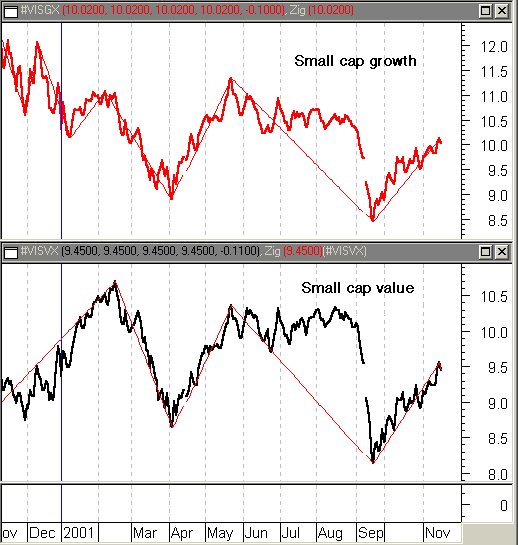
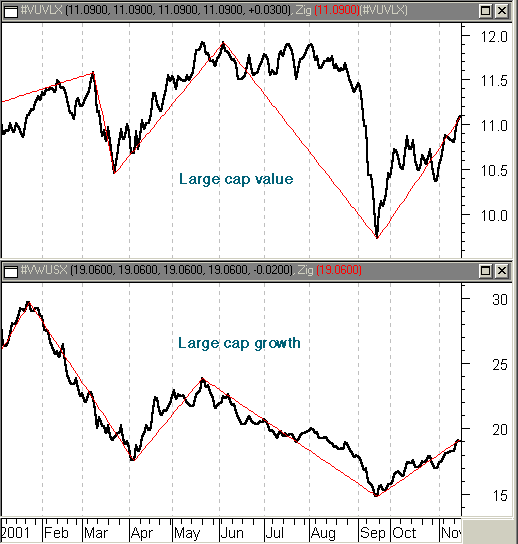
FIVE EASY STEPSUsing the zigzag indicator, which plots price action from pivot point to pivot point, four of Vanguard's mutual funds (representing small-cap value and growth stocks as well as large-cap value and growth stocks) are charted in Figure 1. As the zigzag suggests, there were five major price swings in 2001, and each swing affected the four funds in more or less the same fashion. The only differences between the funds were in the duration of the swings and the actual times when the funds began or ended their participation in them. Broadly speaking, the first swing was an upward movement in January, the second a downward movement into April, the third an upward movement to May, the fourth a downward movement to September, and the fifth swing represents the postSeptember 11th rally.
Figure 1: With small-cap stocks, value and growth issues traded more or less in tandem in 2001.
Looking first at the small-cap stocks, as represented by the Vanguard Index Trust Small-Cap Growth and Value mutual funds, what is immediately apparent is the way the two funds traded in more or less the same fashion for most of the year. Both peaked in February, made troughs at the beginning of April, and peaked again in May. Summer trading saw both funds restricted to a relatively tight range until the big breakdown in September, and the post-attack rally found both small-cap growth stocks and small-cap value stocks moving up near where they began the year. Even the percentage moves between the two mutual funds were comparable, with the greatest variance being in the April rally. That rally saw small-cap growth stocks up 28%, compared to small-cap value stocks moving up 21%. The January rally in 2001 saw small-cap value stocks get off to a better start than their value counterparts (15% value versus 10% growth), although in the wake of September 11 it has been the small-cap growth stocks that have outperformed value stocks 16% to 10%. But what is most apparent is that neither group has done particularly well as of this writing in 2001. In fact, for all the zigging and zagging of the indicator, both small-cap value and small-cap growth stocks have really gone nowhere: The Vanguard small-cap growth stocks are down just under 2% and the Vanguard small-cap value stocks are down just over 2%.
Figure 2: Large-cap stocks in general underperformed small caps, with large-cap growth stocks particularly disappointing investors.
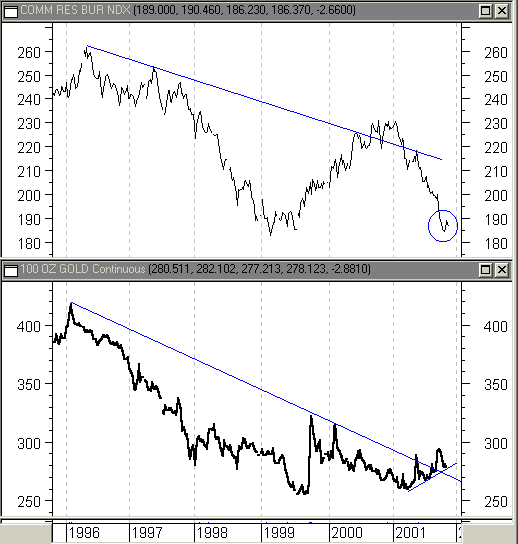
For those looking to the bigger stocks for protection in this market, the large caps were particularly disappointing in 2001. Unlike the small caps, however, there was some distinction to be made between large-cap growth stocks and large-cap value stocks. The same "five-step" sequence in price action rippled through the large caps, but the magnitude and timing of the moves help point out how woefully large-cap growth stocks performed in 2001, while large-cap value stocks, at least, managed to hold their own. Both groups entered 2001 with rallies, much like the small caps. However, the rally in large-cap growth stocks ended relatively abruptly, peaking late in January, while large-cap value stocks continued their advance until March. Nevertheless, the post-rally corrections that visited both groups caused them to trough at roughly the same time — with the large-cap growth stocks bottoming in early April and the large-cap value stocks bottoming in mid-March. Like the small caps, large-cap stocks rallied strongly in April, with large-cap growth stocks tacking on an impressive 37% from April to mid-May. Although large-cap value stocks traded in a range for most of the summer, large-cap growth stocks steadily declined, eventually losing 38% by mid-September. Although both large-cap growth and large-cap value stocks have enjoyed a rally in the wake of the reopening of the markets on September 17, that rally has meant different things to different investors. For those invested heavily in large-cap growth stocks, the group's 21% rally as of early November still meant it was down approximately 30% for the year. On the other hand, those overweighted in large-cap value stocks may find some comfort in that, while they may not have made a great deal of money, they haven't lost a great deal either: Large-cap value stocks are down approximately 1% for the year. If there were choices to be made, then choosing small caps over large caps was perhaps best, given 2001 investment in equities in the first place. This also suggests that diversification between small-cap growth and value stocks would have been a relatively safe way to play equities in 2001's portion of this bear market. GOLD'S GLITTER GONE?What is gold? A staple of jewelry makers? Inflationary hedge? A financial safe haven in times of social turmoil? How about all those and then some? The US economy in general and the greenback in particular are no longer "pegged" to the yellow metal, but it can be a major mistake — or, at least, a significant oversight — to lose track of what gold can tell you about the rest of the economy. This is because gold is perhaps the most sensitive of the commodities to changes in the availability of money. When money is widely available — some would say, when the supply of money exceeds the demand for it — the price of gold, along with other commodities for that matter, tends to rise. This is partly behind the notion that gold prices are a leading indicator of inflation. During the inflationary 1970s (really, 1973 to 1982) the price of gold went from $100 per ounce at the end of 1973 to a high of $850 per ounce at the beginning of 1980. Other commodities, from sugar and corn to scrap iron and steel, saw similar inflationary runups in price. Another way of thinking about the gold/money relationship is that as dollars get less valuable (due to inflation, for example), gold tends to get more valuable. So why watch gold? As the most monetary of all commodities, turns in gold tend to anticipate turns in the rest of the commodities. Both the price of gold and the price of commodities (as represented by the CRB Index, recently acquired by Reuters) have been trending down since 1996, and only now in the price of gold are there signs that commodities may have bottomed. If this is the case, as the upturn in gold as of 2001 seems to suggest, then the long-awaited economic recovery may be closer than previously thought.
Figure 3: Gold rallies in 2001 after a five-year downtrend. Will commodities do the same?
Rising commodities prices in a recession often mark the end of that recession or, at least, the first stirring of expansion and growth. In fact, a number of observers have noted that commodity prices have the shortest lead-time in advance of turns in the business cycle compared to stocks and bonds. With gold as a leading indicator of commodities, watching the yellow metal in addition to commodities indexes such as the CRB Index can help traders and investors get a sense of when a recession or contraction may have run its course.
David Penn may be reached at DPenn@Traders.com.
SUGGESTED READINGMurphy, John J [1991]. Intermarket Technical Analysis, John Wiley & Sons.MetaStock for Windows (Equis International)
Current and past articles from Working Money, The Investors' Magazine, can be found at Working-Money.com. |
Technical Writer for Technical Analysis of STOCKS & COMMODITIES magazine, Working-Money.com, and Traders.com Advantage.
| Title: | Traders.com Technical Writer |
| Company: | Technical Analysis, Inc. |
| Address: | 4757 California Avenue SW |
| Seattle, WA 98116 | |
| Phone # for sales: | 206 938 0570 |
| Fax: | 206 938 1307 |
| Website: | www.traders.com |
| E-mail address: | DPenn@traders.com |
Traders' Resource Links | |
| Charting the Stock Market: The Wyckoff Method -- Books | |
| Working-Money.com -- Online Trading Services | |
| Traders.com Advantage -- Online Trading Services | |
| Technical Analysis of Stocks & Commodities -- Publications and Newsletters | |
| Working Money, at Working-Money.com -- Publications and Newsletters | |
| Traders.com Advantage -- Publications and Newsletters | |
| Professional Traders Starter Kit -- Software | |
PRINT THIS ARTICLE

Request Information From Our Sponsors
- StockCharts.com, Inc.
- Candle Patterns
- Candlestick Charting Explained
- Intermarket Technical Analysis
- John Murphy on Chart Analysis
- John Murphy's Chart Pattern Recognition
- John Murphy's Market Message
- MurphyExplainsMarketAnalysis-Intermarket Analysis
- MurphyExplainsMarketAnalysis-Visual Analysis
- StockCharts.com
- Technical Analysis of the Financial Markets
- The Visual Investor
- VectorVest, Inc.
- Executive Premier Workshop
- One-Day Options Course
- OptionsPro
- Retirement Income Workshop
- Sure-Fire Trading Systems (VectorVest, Inc.)
- Trading as a Business Workshop
- VectorVest 7 EOD
- VectorVest 7 RealTime/IntraDay
- VectorVest AutoTester
- VectorVest Educational Services
- VectorVest OnLine
- VectorVest Options Analyzer
- VectorVest ProGraphics v6.0
- VectorVest ProTrader 7
- VectorVest RealTime Derby Tool
- VectorVest Simulator
- VectorVest Variator
- VectorVest Watchdog


