HOT TOPICS LIST
- Strategies
- Stocks
- Buy
- Investing
- Brokers
- Psychology
- Interviews
- Accumulate
- Sell
- Hold
- Spotlight
- Websites
- Candlestick Corner
- Gold & Metals
- Options Trading
LIST OF TOPICS
CHART ANALYSIS
Those Ubiquitous Fibonacci Ratios
01/02/02 01:02:05 PM PSTby Rudy Teseo
How do I use thee? Let me count the ways.
| What do nature, astronomy, and the stock market have in common? They have something in common you may have heard of, but never really known what it is: a number sequence discovered by a 13th-century mathematician named Leonardo of Pisa and spelled out in his work Liber Abacci. I doubt that he ever considered the sequence, later known as the Fibonacci series -- zero, 1, 1, 2, 3, 5, 8, 13, 21, 34, 55, 89, and so on -- would have the long-lasting effect it did, eventually finding its way into fields he could not have even dreamed of, like stock market analysis and computer programs. But that's exactly what happened.
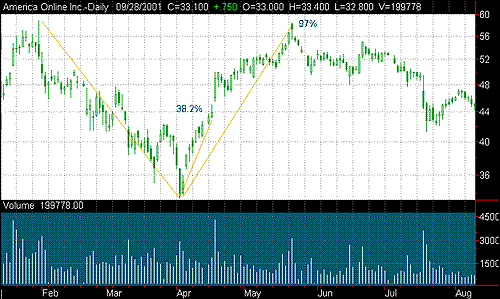
FIBONACCI STUDIESHave you ever bought a stock that had supposedly bottomed, only to have it continue lower? Setting a buy stop can prevent this from happening to you. But how do you place these stops? One of the more popular methods is with Fibonacci ratios. The standard ratios are 38.2%, 61.8%, and 100%, all derived from the sequence, in which a given number is approximately 0.618 times the following number. For example, if the current trend is down and you wish to open a long position, you need to determine a price that, when hit, gives some assurance the stock has reversed direction and is in an uptrend. But to determine this, you need to calculate a future price that meets this goal. If the price retraces 38.2% of the preceding range, there is some assurance it will retrace at least 61.8%, and if it passes that, to go even beyond 100%. Those are the levels where you should place stops. Figure 1 is a good example. We see AOL in the final downtrend to the April 4th low. Anywhere along here might have seemed like a bottom and a good place to buy. However, nowhere was there a 38.2% retracement before the price continued down to the April 4th low. In this downtrend, AOL moved from $58.8 to $33.4 and then reversed. Taking 38.2% of the move (25 points) gives you a buy stop of $43. Admittedly, this costs more than buying at the reversal, which is the risk you want to avoid, but it's the premium you pay for some assurance that the stock is not going to continue lower. AOL climbed to $58.5 before declining again -- a 97% retracement. Not a bad move!
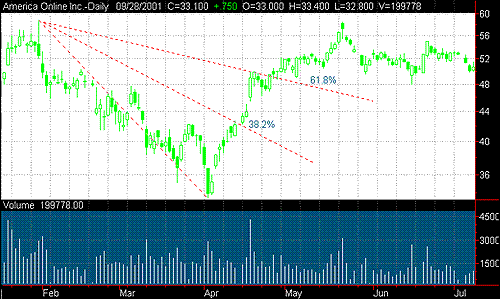
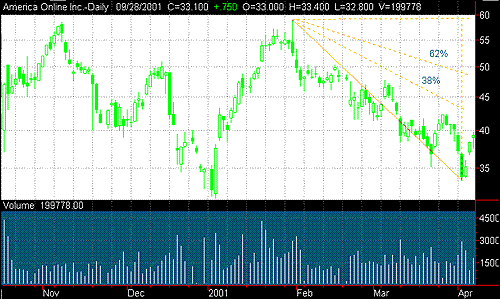
Figure 1: AOL Time Warner (AOL). Here you see the declining range and the 38.2% retracement buy stop. VARIATIONS OF FIBONACCI STUDIESMost chart programs have Fibonacci studies built in, such as arcs, fans, and retracements. When applying any of these three, you will see that a trendline is established between a peak and a trough and the desired study is applied. Figure 2 is overlaid with the Fibonacci fan. The trendline is established between the high of $58.8 and the low of $33.4. The fan is then constructed from the high point. In this illustration, only the 38.2% and 61.8% fan lines are displayed. In most programs, the number of lines -- Fibonacci retracements -- are user options. (This study is similar to the speed lines described in many texts using one-third and two-thirds retracements.) The intersections of the fan lines and the price line project probable price retracements. These can also be considered support and resistance lines. If the price pushes through the 38% line, the 62% line becomes a resistance area and the 38% becomes the support. If the price pushes through the 62% line, you can look for a possible 100% retracement, with 62% being the new support price.
Figure 2: Fibonacci fan display. The different retracement levels may be considered to be support and resistance levels.
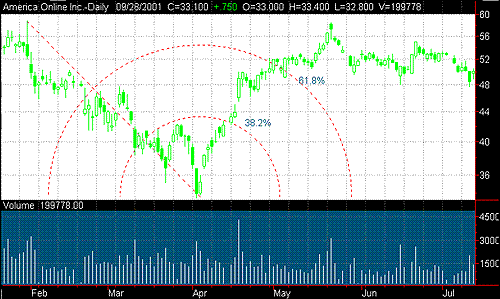
Figure 3 is the same chart with Fibonacci arcs applied. In this case, the trend line is drawn and the arcs are constructed from the low point. Again, only the 38.2% and 61.8% arcs are shown.
Figure 3: Fibonacci arc display. The arcs are merely another method of depicting the different retracement levels.
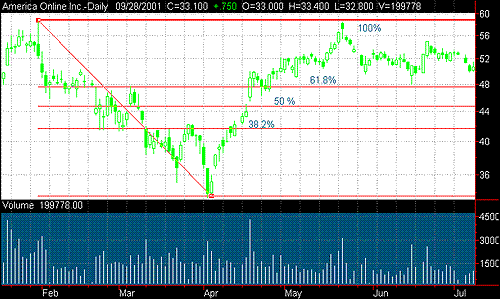
Figure 4 shows the same chart with Fibonacci retracements. This chart is somewhat different, as retracement studies usually contain more options. This recognizes that standard Fibonacci retracements are 23.6%, 32.8%, 50%, 61.8%, 100%, 161.8%, and 261.8% of the previous range. You probably won't see beyond 100% in your program, as the chart goes off the screen.
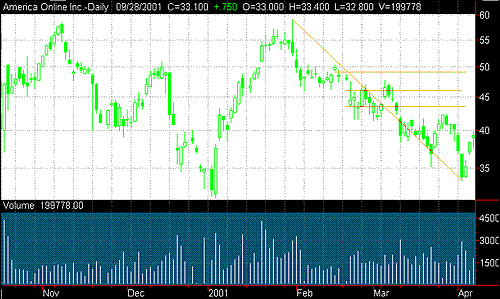
Figure 4: Fibonacci retracement display. Standard Fibonacci retracement levels may be constructed using horizontal lines. If your program does not have Fibonacci studies, you can easily duplicate the retracement study with a calculator and your trendline tool. Figure 5 displays how this would look. The chart has been scrolled back to simulate the downtrend ended on April 4 with no knowledge of where the price is going. First, draw the trendline between the high and the low, then calculate the price for each percentage retracement, and then draw a horizontal line at each price point. Set the trendlines to automatically extend to the right as the chart progresses with time. In this case, the prices were 38.2% = 43, 50% = 46, and 61.8% = 49. For practical purposes, you can round off 38.2% to 38% and 61.8% to 62%. The difference is so small it can't be plotted accurately on a chart.
Figure 5: Using trendline tools to simulate Fibonacci retracements. Retracement levels may be used for price projections.
Another method of constructing these retracement levels can be seen in Figure 6, and approximates the fan study. A trendline is drawn between the high and low, and then a vertical line is constructed between the high and low prices. This line is then intersected with radials at the 38% and 62% points. Again, we see a pattern similar to speed lines.
Figure 6: Fibonacci fans or speed lines. These retracement levels are in relation to the high and low points.
CONCLUSIONFibonacci ratios are useful tools that may be used to help you avoid being caught in false reversals. They can also be used to identify confirmation levels, and hence, to place stop orders on any trade you make. Most technical analysis software has variations of the Fibonacci ratios, making them simple to apply.
Rudy Teseo is a retired communications and computer consultant. He has also taught courses in option trading and basics of stock charting. Contact him at rftess@juno.com. SUGGESTED READING Teseo, Rudy [2001]. "The Gartley Setup," Technical Analysis of STOCKS & COMMODITIES, Vol.19: January. _____ [2001]. "The Butterfly Setup," Technical Analysis of STOCKS & COMMODITIES, Vol 19: April. SuperCharts (TradeStation Technologies) Current and past articles from Working Money, The Investors' Magazine, may be found at Working-Money.com.
|
Rudy Teseo is a private investor who trades stocks, options, and currencies. He has taught classes in technical analysis and option trading. He may be reached at rftess@optonline.net.
| E-mail address: | rftess@optonline.net |
PRINT THIS ARTICLE

Request Information From Our Sponsors
- StockCharts.com, Inc.
- Candle Patterns
- Candlestick Charting Explained
- Intermarket Technical Analysis
- John Murphy on Chart Analysis
- John Murphy's Chart Pattern Recognition
- John Murphy's Market Message
- MurphyExplainsMarketAnalysis-Intermarket Analysis
- MurphyExplainsMarketAnalysis-Visual Analysis
- StockCharts.com
- Technical Analysis of the Financial Markets
- The Visual Investor
- VectorVest, Inc.
- Executive Premier Workshop
- One-Day Options Course
- OptionsPro
- Retirement Income Workshop
- Sure-Fire Trading Systems (VectorVest, Inc.)
- Trading as a Business Workshop
- VectorVest 7 EOD
- VectorVest 7 RealTime/IntraDay
- VectorVest AutoTester
- VectorVest Educational Services
- VectorVest OnLine
- VectorVest Options Analyzer
- VectorVest ProGraphics v6.0
- VectorVest ProTrader 7
- VectorVest RealTime Derby Tool
- VectorVest Simulator
- VectorVest Variator
- VectorVest Watchdog

