HOT TOPICS LIST
- Strategies
- Stocks
- Buy
- Investing
- Brokers
- Psychology
- Interviews
- Accumulate
- Sell
- Hold
- Spotlight
- Websites
- Candlestick Corner
- Gold & Metals
- Options Trading
LIST OF TOPICS
THE CHARTIST
What Are Pivots?
02/19/02 01:55:00 PM PSTby Dennis D. Peterson
More than just an alternative to indicators, pivots can be used to better understand market behavior.
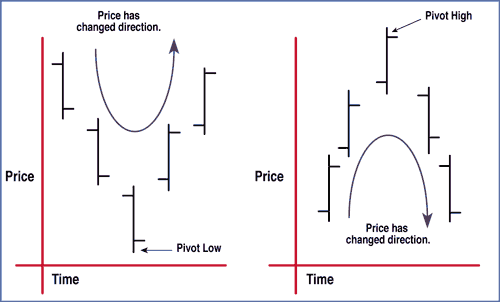
| The appearance of pivots on a chart suggests the market has made a decision about price action. Pivots are points at which the price changes direction. In many ways, they are more useful than indicators are. You will also find that pivots are the basis of many technical articles, and frequently part of trading strategies. Simply put, pivots are turning points (Figure 1). If the open-high-low-close (OHLC) bars before and after a bar have lows above the low of the bar, then the bar is a pivot low. If the OHLC bars before and after a bar have lows below the low of the bar, then the bar is a pivot high. I prefer to see the highs or lows preceding the bar clearly indicate a trend or swing. Generally, I wait till at least three bars appear after the candidate pivot point before I determine a bar is a pivot; I don't want to get caught with a third-day reversal (what that is, I'll explain shortly).
Figure 1: Pivot low (left) and pivot high (right). An open-high-low-close bar with higher low bars on either side is a pivot low. A bar with lower highs on either side is a pivot high.
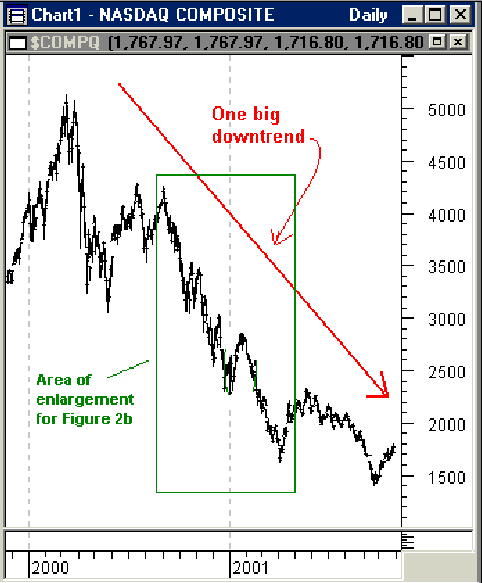
THE BUILDING BLOCKS OF PRICE TRENDIn order to understand the role of a pivot, you need to understand the broader context of trends, swings, pivots, and reaction/rally days. Pivots are the smallest unit. Trends are composed of swings, and within swings are reaction and rally days, which form pivots (Figures 2A and 2B).
Figure 2A: Daily Nasdaq Composite prices. During the last year and a half the Nasdaq has been in a severe downtrend. Some rallies last only two or three days, while others are more substantial and should be identified as swings.
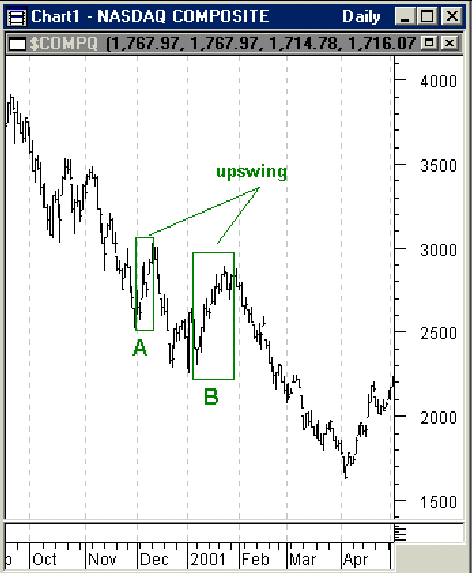
Figure 2B: Downtrends. From October 2000 to April 2001 the rallies that lasted more than two days are swings.
A reaction day is one where the low of the day is lower than the low of the previous day and the high is less than or equal to the previous day's high. A rally day is one where the high is higher than the high of the previous day (see Figure 1) and the low is greater than or equal to the previous day's low. To explain this, let's look at trends versus swings, and then we'll look at swings and pivots. The Nasdaq Composite has been in a sharp downtrend from March through September 2000 (Figure 2A), interrupted by periodic rallies, characterized by those of two or three days of upward price movement and those exceeding three days (Figure 2B). The stronger rallies referred to as swings indicate possible trend reversals. During a downtrend a potential reversal occurs when the high of the current swing is greater than the previous swing high. But the high of upswing B in Figure 2B is less than the high of upswing A, so the downtrend continues. When both the swing high and swing low are greater than the previous swing high and low, you can remove the qualification "potential" and call it a downtrend reversal. The opposite is true for uptrends. When you are trading, knowing the trend direction is crucial. Bucking the trend is the most common way to lose money. Two days of direction counter to the trend don't necessarily mean a change in trend direction. For that, you need to see more days of counterdirection, and for that you need to look for swings.
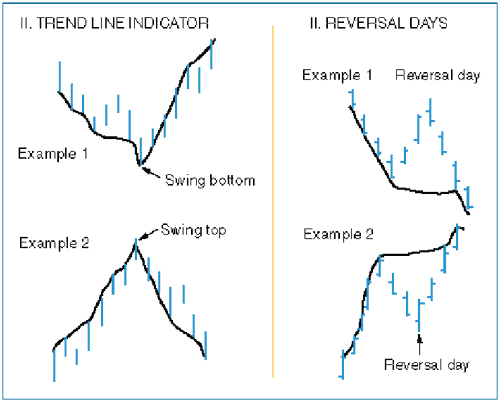
DEFINING SWINGSCurtis Arnold, technician and sometime contributor to our sister magazine STOCKS & COMMODITIES, states that in a downtrend a swing occurs when there are three days of higher highs and in an uptrend when there are three days of lower lows. The exception is a reversal day, which is a temporary retracement that has not created a swing point. The sign of a reversal is the reversal day itself. In a downtrend, Arnold notes that "a reversal day top occurs when prices move higher but then close near the lows of the day, usually below their opening and below the midpoint of the day's range. An even stronger reversal is indicated if the close is below yesterday's close" (Figure 3). The opposite applies for uptrends. A third-day reversal requires that you pay attention to the open and close of the third day of successive days of higher highs or lower lows. In Figure 3 there are no open or close indicators on the bars on the trendline indicator charts, but there are on the reversal days charts. When reversal days occur, you don't declare swings. No swings means you maintain the current trend.
Figure 3: Swings and reversals. On the left is a downtrend turning point, a swing bottom or low. An uptrend turning point is a swing top or high. On the right it's clear that there is no swing point created if a rally or reaction occurs where the third day reverses the rally or reaction.
A third-day reversal event occurs when there are three rally or reaction days in a row. On the third day the close finishes near the low or high for successive rally or reaction days, respectively, relative to the midpoint of the third day range (highlow). While swings are essential to validate trend directions, reaction and rally days can be used for either trends or sideways movements. When you examine pivots, you are opening the door for a clearer way to trade the market.
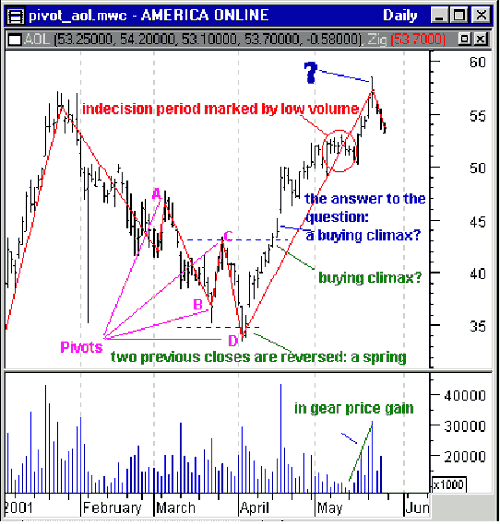
VALIDATING PIVOTSWhat do pivots say about the direction or trend of price? Pivots help you see a trend change and define the behavior. If you have been looking at charts for a while, you may have noticed that prices fall faster than they rise. You can verify this with a handy indicator called zigzag, which allows you to declare a pivot based on price percentage change or point change. Suppose I defined pivots using the definition of three successive highs or lows, being mindful of third-day reversals (if the third day is a reversal day, I will not declare a pivot). To validate my choice of pivots using daily highs and lows, I apply the zigzag to declare pivots only if there is an 8% price change in a downtrend. For an uptrend I start with a 5% change. You can see an example of applying the zigzag on the daily chart of AOL Time Warner (AOL) in Figure 4. My choices of pivots (labeled A, B, C, and D) using rally and reaction days coincide with the zigzag. You will see this with any stock that has strong trading volume (more than one million shares traded per day).
Figure 4: AOL Time Warner (AOL). Pivots B and D identify upswings moving counter to the downtrend. Pivots A and C identify downswings keeping with the downtrend. Zigzag with an 8% change is shown in red overlaying price history and matches pivot choices made using rally and reaction days.
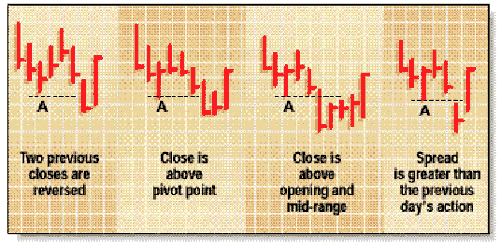
USEFUL PATTERNSWhen looking at Figure 4, you might consider the following: Pivot D was the first retest of the low established by pivot B. There is a clue coming into this retest: C had low volume, meaning there wasn't a heavy hitter looking to sell. That means there could be an upswing and a push right through the price at C. When the low of pivot B is exceeded by the close of the bar on April 3, what will happen on April 4? The close of April 4 is above that of April 3 (Figure 4, pivot D), creating a spring. (Springs have patterns such as those displayed in Figure 5.) On April 5 the spring unloads and prices gap up. Your trade would go long at the open of April 5 if it is above the high of April 4 — a confirmed spring.
Figure 5: Spring patterns. Various patterns make upsprings.
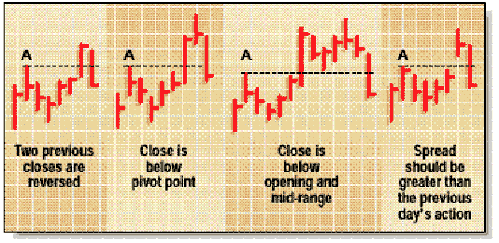
You are now riding the price up, and the next event will be the price established by pivot point C. Is the price going to be an upthrust that meets with a buying climax? As you can see from Figure 6, upthrusts also have patterns. On April 16 the first part of a potential upthrust pattern took place, but on April 17 an upthrust pattern failed. That means prices are likely to continue moving up, and on April 18 that was confirmed. Your trade would have been to get out on April 16 and go long on April 18 if the open was higher than the close of April 17.
Figure 6: Upthrust patterns. Various patterns are visible during upthrusts.
ARE PIVOTS SUCCESSFUL?I'll use Figure 4 to test the success of pivots. The price labeled with a question mark is clearly a pivot, with prices rising prior and declining afterward. So will the prices continue to decline after May 25? It's likely they will. There is very little support at $58. The first real test will be when prices reach what they were at pivot point A, that is, around $47. In its ride down, it's possible AOL will form a pivot before it hits $47 at about $50. If AOL goes below 50, then $47 will be a major test. In October (not seen), once AOL failed to move above $47 in July and in early August, the price of AOL went lower. This suggests that pivots indeed are successful.
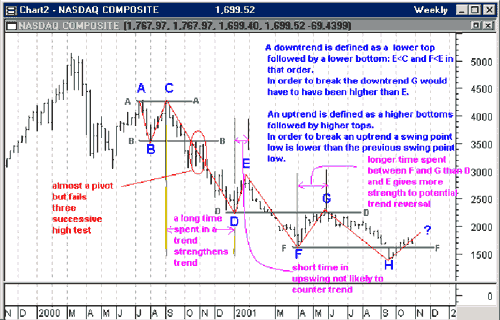
USE BASIC BLOCKS OR GO HIGHER?When considering pivots, it is possible to go down to ticks, the very basic building blocks of price action, but at this level you will need software that allows you to do three things: (1) group ticks together, as in, what direction has price gone for the last 50 ticks? (2) compare group tick behavior with minute interval data; and (3) perhaps exclude trades that are less than 5,000 shares per block. But you don't have to use tick data. You can use weekly data to gain insight, and the techniques for weekly data can also be applied to daily and monthly data. Examining the Nasdaq composite weekly data for the last year and half, I found seven swing points (Figure 7). So what constitutes a trend in terms of swing points? Higher bottoms and higher tops identify an uptrend, while lower highs and lower bottoms identify a downtrend.
Figure 7: Weekly Nasdaq data. Pivots are useful to define support and resistance. Lines AA, BB, CC, DD, and FF are created using pivots A, B, C, D, and F. Pivot F marked support that was broken with a gap down on 9/17/2001, very likely due to 9/11/01. Swing strength can be measured by the length of time of the swing.
TRENDS AND SWINGSAn uptrend is broken, but not necessarily reversed, if a swing point low is lower than the previous swing point low. An uptrend is maintained if you look at a swing point low and see that the next one is higher. Uptrends move in a low-high-low pattern, the test being if the current low is higher than the previous one. Conversely, downtrends are broken, but not necessarily reversed, when the current high exceeds the previous swing point high. Downtrends move in a high-low-high pattern, with the test being whether the current high is lower than the previous one. Given these definitions, analyzing the price data in Figure 7, the Nasdaq composite is in a downtrend. I have connected each of the swing points, or pivots, with a red line (Figure 7) so price direction is more discernible. But simply seeing price direction doesn't indicate anything about the strength of that direction.
SWING STRENGTHIs there such a thing as swing strength? The answer is yes, and here is an approach you might want to consider. The basis for it is that in a downtrend, equities spend little time being overbought before being sold for profit, and at the same time equities spend longer being oversold. Just the opposite is true for uptrends. Equities remain overbought longer than they remain oversold. This is because people anticipate higher prices and are ready to snap up any bargains. The result? The longer you spend in a swing, the greater the strength. You can see the upswing D-E is short relative to the time spent in the downswing from C-D. And this should come as no surprise, considering the time length of C-D. But the upswing F-G is longer than the previous upswing D-E, which means the downtrend is losing strength. If the next upswing is longer than F-G, it could be the start of a trend reversal. If it is shorter, the Nasdaq composite is likely to go down further. Swing point validity is evinced by the effective way support and resistance levels are created. For example, swing point A defines the resistance line A-A for swing point C (Figure 7). Similarly, swing point B defines resistance line B-B. A pivot or swing point was almost formed as prices went back up to meet line B-B. These support and resistance levels can be used to set stops.
SUMMARYPivots form the basis for analyzing price direction. It is important to note that pivots don't simply reflect profit-taking, which is a normal short-term action and not indicative of a trend reversal. As turning points, pivots represent tests and retests of lows and highs. This makes it possible to recognize patterns that give rise to springs and upthrusts. Pivots, whether used on monthly, weekly, or daily charts, often identify support and resistance levels. You may also use finer-grain data such as ticks or intraday interval data to determine the type of trading day. Ultimately, pivots help determine what today's price action is relative to yesterday's or the day before.
Dennis Peterson can be reached at DPeterson@Traders.com.
RELATED READINGArnold, Curtis [1983]. "Gann," Technical Analysis of STOCKS & COMMODITIES, Volume 1: March.Peterson, Dennis [2001]. "Volume Analysis," Traders.com Advantage, May 21. |
Market index trading on a daily basis.
| Title: | Staff Writer |
| Company: | Technical Analysis, Inc. |
| Address: | 4757 California Ave SW |
| Seattle, WA 98116-4499 | |
| Phone # for sales: | 206 938 0570 |
| Fax: | 206 938 1307 |
| Website: | working-money.com |
| E-mail address: | dpeterson@traders.com |
Traders' Resource Links | |
| Charting the Stock Market: The Wyckoff Method -- Books | |
| Working-Money.com -- Online Trading Services | |
| Traders.com Advantage -- Online Trading Services | |
| Technical Analysis of Stocks & Commodities -- Publications and Newsletters | |
| Working Money, at Working-Money.com -- Publications and Newsletters | |
| Traders.com Advantage -- Publications and Newsletters | |
| Professional Traders Starter Kit -- Software | |
PRINT THIS ARTICLE

Request Information From Our Sponsors
- StockCharts.com, Inc.
- Candle Patterns
- Candlestick Charting Explained
- Intermarket Technical Analysis
- John Murphy on Chart Analysis
- John Murphy's Chart Pattern Recognition
- John Murphy's Market Message
- MurphyExplainsMarketAnalysis-Intermarket Analysis
- MurphyExplainsMarketAnalysis-Visual Analysis
- StockCharts.com
- Technical Analysis of the Financial Markets
- The Visual Investor
- VectorVest, Inc.
- Executive Premier Workshop
- One-Day Options Course
- OptionsPro
- Retirement Income Workshop
- Sure-Fire Trading Systems (VectorVest, Inc.)
- Trading as a Business Workshop
- VectorVest 7 EOD
- VectorVest 7 RealTime/IntraDay
- VectorVest AutoTester
- VectorVest Educational Services
- VectorVest OnLine
- VectorVest Options Analyzer
- VectorVest ProGraphics v6.0
- VectorVest ProTrader 7
- VectorVest RealTime Derby Tool
- VectorVest Simulator
- VectorVest Variator
- VectorVest Watchdog

