HOT TOPICS LIST
- Strategies
- Stocks
- Buy
- Investing
- Brokers
- Psychology
- Interviews
- Accumulate
- Sell
- Hold
- Spotlight
- Websites
- Candlestick Corner
- Gold & Metals
- Options Trading
LIST OF TOPICS
Investor's Toolkit 4 Pro
01/22/02 02:54:04 PM PSTby Sean Moore
The official software of the National Association of Investors Corp.
Inve$tWare Corp. Investor's Toolkit is the official software of the National Association of Investors Corp. (NAIC), a nonprofit organization committed to teaching successful stock investing techniques. Ellis Traub, a director of the Southeast Florida chapter of the NAIC, the founder and chairman of Inve$tware Corp., and a recognized expert on computerized investing, developed the software. After retiring from his career as an airline pilot, Traub renewed an earlier interest in the stock market after attending a seminar offered by the NAIC. He was intrigued by the organization's goal of doubling the investor's money every five years using long-term investing techniques. To that end, Traub, a frequent speaker at NAIC conferences and developer of the group's official software products, has coined the term "technamental investing" (which he defines as a visual analysis of the fundamental financial data of a company to forecast its future operational and stock price performance) to describe the method for producing a 15% yearly return on investment. Traub has also written Take Stock: A Roadmap To Profiting From Your First Walk Down Wall Street, which explains the organization's methodology in detail and provides additional insight for software users.
INSTALLATION AND SETUPThanks to the installation wizard, installing and registering the software was painless. Like most financial software, in order to get up and running, Investor's Toolkit requires fundamental data to effectively analyze the stocks of your choosing. The data can be input manually via sources such as Value Line and S&P Reports, or electronically via a number of online sources. Inve$tWare Corp. offers an unlimited data subscription for $99 per year or $10 per month (a subscription is not required, but it is an easy way of getting the necessary fundamental data). The data can be downloaded from the company's website, investware.com. Once you have a datafile for a stock, you're ready to begin your analysis.
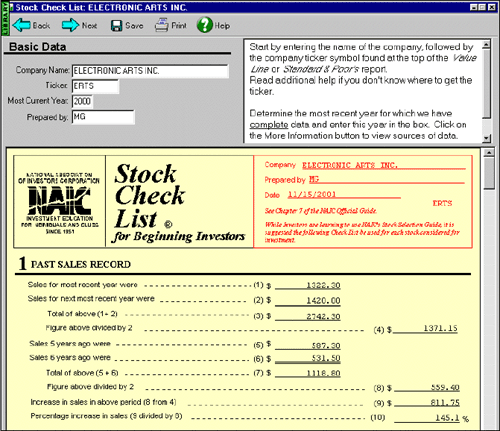
FEATURESBeginners can take advantage of the Stock Check List feature of the software. The checklist tutorial asks a number of questions to help you determine if a company you're interested in is a good value. Following NAIC rules, a stock will need to display sales growth and earnings per share growth of 14.9% compounded annually to double in a five-year time span. The checklist will also check the price/earnings ratio to see if the stock is selling at a reasonable price. The company's P/E ratio is given an acceptable rating if it does not exceed 20. Figure 1 shows an example of the Stock Check List feature.
Figure 1: Stock Check List. The checklist helps you determine easily and quickly whether a stock has growth potential and is a good value.
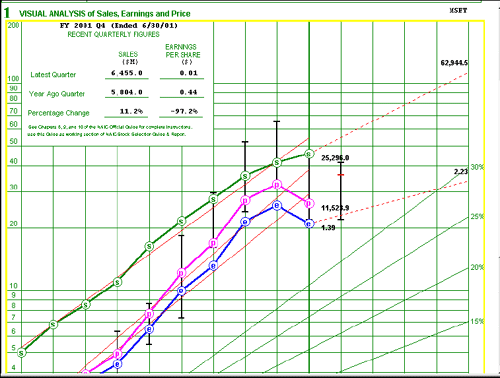
More experienced users and investors can take advantage of the Stock Selection Guide feature. The selection guide is similar to the Stock Check List in that it evaluates growth, earnings, and price, but it also incorporates visual analysis (charts), risk and reward, and five-year potential. The visual analysis allows you to see the current trends for sales, earnings, and pretax profits. The visual analysis also aids in estimating future sales and growth rates because the software allows the user to extrapolate the trends and estimate where the rates will fall several years down the road. This visual analysis is illustrated in Figure 2.
Figure 2: The visual analysis section of the Stock Selection Guide graphs sales, earnings, and pretax profits.
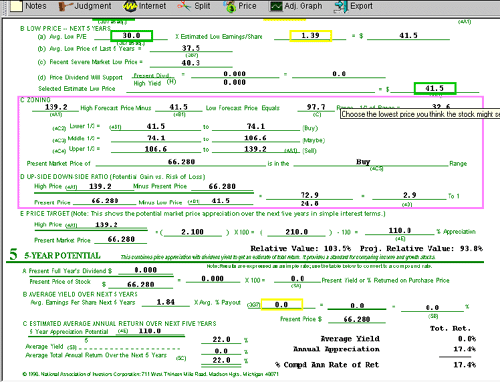
The risk and reward section estimates high and low potential P/E ratios and stock prices. From these estimates, the software calculates "buy," "maybe," and "sell" ranges and displays where the current price of the stock falls. This analysis can be seen in the top half of Figure 3. Finally, the five-year potential section estimates the potential return on your investment. Once again, in order to double your money every five years, the projected annual return of your portfolio needs to be at least 15%. The bottom half of Figure 3 contains the five-year potential section.
Figure 3: Risk/reward and five-year potential. These are the conclusion sections of the Stock Selection Guide. The pink box highlights the results of the risk/reward analysis and shows where the current market price falls within its projected ranges: buy, sell, or maybe. The bottom section highlights the five-year potential for a stock.
Another feature of the software is the Stock Comparison Guide. This guide allows for comparison between stocks of interest and can be used to narrow down final choices or to find the best stock in a particular growth industry.
CONCLUSIONIn all, the Investor's Toolkit is a powerful program with many useful features for fundamentally analyzing stocks and optimizing portfolio performance. The NAIC investing philosophy is the backbone of the software; a buy-and-hold strategy focused on high-growth stocks selling at a good value. The in-depth fundamental analysis may take some getting used to, but if you're serious about investing, you'll probably want to know about the relationships between sales, growth, profits, and stock prices. The Investor's Toolkit will definitely help you understand these relationships and learn how to meet the NAIC goal of doubling your money every five years.
Sean Moore may be reached at SMoore@Traders.com. |
Traders.com Staff Writer.
| Title: | Project Engineer |
| Company: | Technical Analysis, Inc. |
| Address: | 4757 California Ave. SW |
| Seattle, WA 98116 | |
| Phone # for sales: | 206 938 0570 |
| Fax: | 206 938 1307 |
| Website: | www.traders.com |
| E-mail address: | smoore@traders.com |
Traders' Resource Links | |
| Charting the Stock Market: The Wyckoff Method -- Books | |
| Working-Money.com -- Online Trading Services | |
| Traders.com Advantage -- Online Trading Services | |
| Technical Analysis of Stocks & Commodities -- Publications and Newsletters | |
| Working Money, at Working-Money.com -- Publications and Newsletters | |
| Traders.com Advantage -- Publications and Newsletters | |
| Professional Traders Starter Kit -- Software | |
PRINT THIS ARTICLE

Request Information From Our Sponsors
- StockCharts.com, Inc.
- Candle Patterns
- Candlestick Charting Explained
- Intermarket Technical Analysis
- John Murphy on Chart Analysis
- John Murphy's Chart Pattern Recognition
- John Murphy's Market Message
- MurphyExplainsMarketAnalysis-Intermarket Analysis
- MurphyExplainsMarketAnalysis-Visual Analysis
- StockCharts.com
- Technical Analysis of the Financial Markets
- The Visual Investor
- VectorVest, Inc.
- Executive Premier Workshop
- One-Day Options Course
- OptionsPro
- Retirement Income Workshop
- Sure-Fire Trading Systems (VectorVest, Inc.)
- Trading as a Business Workshop
- VectorVest 7 EOD
- VectorVest 7 RealTime/IntraDay
- VectorVest AutoTester
- VectorVest Educational Services
- VectorVest OnLine
- VectorVest Options Analyzer
- VectorVest ProGraphics v6.0
- VectorVest ProTrader 7
- VectorVest RealTime Derby Tool
- VectorVest Simulator
- VectorVest Variator
- VectorVest Watchdog


