HOT TOPICS LIST
- Strategies
- Stocks
- Buy
- Investing
- Brokers
- Psychology
- Interviews
- Accumulate
- Sell
- Hold
- Spotlight
- Websites
- Candlestick Corner
- Gold & Metals
- Options Trading
LIST OF TOPICS
MARKET UPDATE
Bonds And Stocks: Together Again?
01/15/02 04:34:55 PM PSTby David Penn
After two and a half years of divergence, bond prices look to lead stock prices once again.
| Most of the time during the secular bull market of the 1980s and 1990s, bond prices led stock prices. However, there were at least four instances (including one at the beginning and one at the end of the secular bull) in which this pattern did not hold true and bond prices diverged from, or moved opposite to, stock prices. Such instances in which this bonds-lead-stocks relationship is severed, and the two move in divergent directions, may indicate a major shift in the marketplace for securities. This may be a signal that the market is transitioning from one leg of a bull market to another or, on another order of magnitude, that a secular bull market is moving into a secular bear. A secular bull market is a period in which the long-term price trend is up, a "buy the dips" strategy is profitable, and even a buy-and-hold approach to investing is hard to beat. In contrast, a secular bear market features a long-term trend that is flat or down, with the market either trading persistently within a given range or marked by major downswings and sharp, short rallies. The relationship between bond prices and stock prices may have been one of the most valuable revelations of intermarket technical analysis. There have long been some commonsense notions that as yields on the guaranteed rates of return from bonds declined, driving bond prices up, more people would begin to look to the equity markets for a better return on their capital. But a formal discussion of this relationship between bond prices and stock prices was not widely available until John Murphy's Intermarket Technical Analysis was published in 1991.
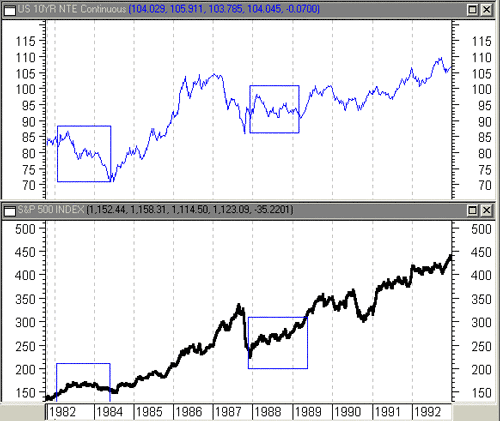
Figure 1: Two bond price/stock price divergences in the 1980s. Both divergences followed periods of major financial distress and insecurity.
Murphy's basic dataset, the 1980s, provides ample evidence of bond prices leading stock prices. For example, to determine the beginning of the secular bull market just ended, we can look less to the stock market rally in early 1983 — the gains from which had been largely lost a year later — and more to the stock rally in mid-1984, which was accompanied by an explosive advance in the bond market. Even as stocks stagnated in the second half of 1984, the continued climb of bond prices suggested that the stock market would soon come out of its malaise. From 1985 to the end of 1986, the Standard & Poor's 500 tacked on 56%. In addition, the 198283 period is the first instance of bond price/stock price divergence in the secular bull market of the 1980s and 1990s. I'll discuss more about this kind of divergence later. For now, suffice it to say that extended periods when bond prices and stock prices are diverging suggest a marketplace under duress, one that is usually resolved by lingering weakness in either bonds or stocks. The relationship between bond prices and stock prices is even more starkly revealed in the context of the stock market meltdown in late 1987. While the stock market was rocketing upward in 1986, bond prices had begun to stall out. In fact, by the first quarter of 1986, bond prices had already begun to show surprising weakness, given their two-year bull market. Three separate attempts to take out the 10-year Treasury's high at 104.5 (April, August, and December 1986), for example, all failed, and the bond market entered 1987 with a year's worth of topside resistance and an unconvincing set of higher lows. The bond market break came early in 1987. Topping out in March, the 10-year note lost 19% by October. Stocks, on the other hand, continued to rally well into 1987. But the bond market collapse, which sent interest rates soaring, was too much for a stock market entering the third year of its bull market. The S&P 500 topped out at 337 in October and lost 34% from that peak to year's end. Through this period, bond prices had been a reliable indicator of stock prices, with a reasonable lag of a few months. But this relationship broke down in 1988, with stocks rallying steadily from the 1987 lows as bond prices continued to drift down for the year. In fundamental terms, stocks were in a post-selloff rally mode, yet money remained relatively tight (that is, there were no major new lows in bond prices, but lower highs were the norm: an ascending triangle shape). Arguably, this led to the bear market in stocks from mid-1989 (shortly after the losses from the October 1987 stock market collapse were fully retraced) until 1991. The bond price/stock price relationship that had been so reliable in the 198387 period asserted itself once again.
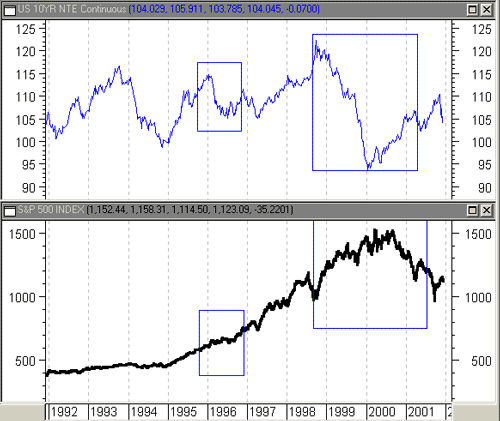
Figure 2: The divergence of 1995-96 hurt bonds more than stocks. But the age of "irrational exuberance" in the stock market would be coming soon.
The bond/stock relationship became more complex early in the second half of the secular bull market, due largely to increased volatility in bond prices during a period of relative stock market stagnation. Bonds, while volatile, did lead stocks out of the 198991 bear market; stocks rallied strongly from 1991 to 1994, gaining about 67%. And while the bond market suffered a real collapse after topping out in 1993, losing 16% from October 1993 to November 1994, the stock market suffered only a mildly bearish trading range in 1994. The bond rally in the wake of the selloff characterized 1995, with stocks following suit with an upyear of their own. However, there was again a period of divergence with bond and stock prices as the bond market failed to take out the previous 1993 highs at the end of 1995, entering instead a bear market that lasted until mid-1997. During this period, stocks advanced — both 1996 and 1997 were upyears for equities — though bond peaks in late 1995 and late 1996 did anticipate corrections in stocks (buying opportunities, as it turned out). Still, after the period of divergence, bonds returned to leading stocks in 1997. As powerful as the bond market warning was in the spring of 1987, the alert that went out as the bond market peaked in mid-1998 would be truly an all-points bulletin. While stocks soared leading up to and in the wake of a mid-1998 correction, bonds topped out and, from October 1998 to January 2000, lost 23% (as represented by the 10-year Treasury) in one of the most stunning bond market collapses in recent history. Stocks continued as usual, peaking just a few months after the bond market bottomed. The stock market break finally came in the fall of 2000, with the bond market having already retraced almost half of its 1998 collapse. Currently, the bond price/stock price relationship looks as though it is ending its nearly three-year period of divergence. The divergence period began with the stock market rally in 1998, a rally that came as the bond market continued to deteriorate. It is hard not to consider this part of the equity advance as pure bubble, given the lack of support from the bond market. Indeed, a number of stock market indicators (such as advances vs. declines and new highs vs. new lows) warned that the stock market was in a precarious condition. The divergence period contained the bond market collapse from 1998 to the bond market bottom at the beginning of 2000, as well as the bond market rally into the spring of 2001. For stocks, the divergence period included the rally from the 1998 correction, the peaks of 2000, and the subsequent crash in the spring of 2001. There are signals that the divergence period — a period of dislocation between interest rate incentives and stock price realities — might be over, in the form of the spring 2001 correction in the bond rally. This rally, lasting about 1.75 years from 2000 to late 2001, appears to have finished, retracing about half of the 19982000 bear market. With the Federal Reserve nearing the end of its rapid-fire rate-cutting offensive, higher real interest rates are likely in the near future, as the falling bond prices that characterized the end of 2001 also seemed to suggest. It is hard to imagine stocks — in a bear market that is about a year and a half old (200001) — appreciating in a rising interest rate environment. Should stocks succumb and drift down again, the bond market peak in late 2001 might be remembered as the signal that the war rally in stocks was over, and the time when stocks and bonds were back together again.
David Penn is a Staff Writer for Working Money.
Current and past articles from Working Money, the Investors' Magazine, may be found online at Working-Money.com. |
Technical Writer for Technical Analysis of STOCKS & COMMODITIES magazine, Working-Money.com, and Traders.com Advantage.
| Title: | Traders.com Technical Writer |
| Company: | Technical Analysis, Inc. |
| Address: | 4757 California Avenue SW |
| Seattle, WA 98116 | |
| Phone # for sales: | 206 938 0570 |
| Fax: | 206 938 1307 |
| Website: | www.traders.com |
| E-mail address: | DPenn@traders.com |
Traders' Resource Links | |
| Charting the Stock Market: The Wyckoff Method -- Books | |
| Working-Money.com -- Online Trading Services | |
| Traders.com Advantage -- Online Trading Services | |
| Technical Analysis of Stocks & Commodities -- Publications and Newsletters | |
| Working Money, at Working-Money.com -- Publications and Newsletters | |
| Traders.com Advantage -- Publications and Newsletters | |
| Professional Traders Starter Kit -- Software | |
PRINT THIS ARTICLE

|

Request Information From Our Sponsors
- StockCharts.com, Inc.
- Candle Patterns
- Candlestick Charting Explained
- Intermarket Technical Analysis
- John Murphy on Chart Analysis
- John Murphy's Chart Pattern Recognition
- John Murphy's Market Message
- MurphyExplainsMarketAnalysis-Intermarket Analysis
- MurphyExplainsMarketAnalysis-Visual Analysis
- StockCharts.com
- Technical Analysis of the Financial Markets
- The Visual Investor
- VectorVest, Inc.
- Executive Premier Workshop
- One-Day Options Course
- OptionsPro
- Retirement Income Workshop
- Sure-Fire Trading Systems (VectorVest, Inc.)
- Trading as a Business Workshop
- VectorVest 7 EOD
- VectorVest 7 RealTime/IntraDay
- VectorVest AutoTester
- VectorVest Educational Services
- VectorVest OnLine
- VectorVest Options Analyzer
- VectorVest ProGraphics v6.0
- VectorVest ProTrader 7
- VectorVest RealTime Derby Tool
- VectorVest Simulator
- VectorVest Variator
- VectorVest Watchdog


