

HOT TOPICS LIST
- Strategies
- Stocks
- Buy
- Investing
- Brokers
- Psychology
- Interviews
- Accumulate
- Sell
- Hold
- Spotlight
- Websites
- Candlestick Corner
- Gold & Metals
- Options Trading
LIST OF TOPICS
DOW THEORY
Forming A Dow Line
02/05/02 02:14:48 PM PSTby David Penn
Whether you are buying or selling, believe it or not, it's good to wait in line.
| One of the most common aspects of chart reading, the notion of buying or selling breakouts from congestion, has its roots in Dow theory — specifically, in the part of Dow theory that describes line formation. In this context, a "line" is an area in which prices neither advance nor decline by a significant amount over a given period. This period may last anywhere from a few weeks to several months, as the aggressiveness (or lack thereof) of buyers is met with equal aggressiveness (or lack thereof) on the part of sellers. This equilibrium, however, is often short-lived. Sooner or later in most instances, one group — buyers or sellers — blinks. It could be that buyers, having seen prices rise and rise, grow nervous as the number of bearish indications increases. Conversely, sellers who have enjoyed a price decline can find themselves uneasy during an equilibrium period. In this case, sells come too easily, as if buyers are more than willing to scoop up shares that sellers have discounted. LINES, ACCUMULATION, AND DISTRIBUTIONBoth accumulation and distribution occur during line formation, and it can be difficult to predict whether a line that forms during a trend will be an accumulation or distribution line. The simultaneous process of accumulation and distribution is also referred to as stock changing from stronger to weaker owners, and vice versa. This means that better-informed investors may use lines as an opportunity to sell shares into a previously advancing market to less-informed, often retail, individual investors. In this situation, the stronger hands are doing the distributing — ostensibly in advance of an anticipated market decline — and the weaker hands are doing the accumulating. The opposite might be the case at the end of a downtrending market. Stronger hands, confident (or at least liquid enough to believe) in the possibility of a bottom, will begin to accumulate the heavily discounted shares. From whom will they acquire these shares? From weaker, less-informed hands that have held on to their depreciating assets during the decline and are only now too glad to sell. Should the stronger hands be proved right, they will have the advantage of buying quality stock at thoroughly bargain-basement prices. All this helps to underscore the role that lines play in price action. At times, lines can also function as a continuation of accumulation/distribution areas in a trend, as opposed to being an indication that a trend may be topping or bottoming. This aspect of Dow theory can be found in a number of contemporary congestion breakout/breakdown strategies. The idea is that moves up from Dow lines can be suggestive of new or renewed advances, and moves down from Dow lines often hint at new declines. These moves are all the more significant when they occur with large trading volume. Mental or physical stops placed just inside the line area help those using such strategies to avoid big losses if the breakout does not succeed or, worse, if the line did in fact suggest that a reversal was in store.
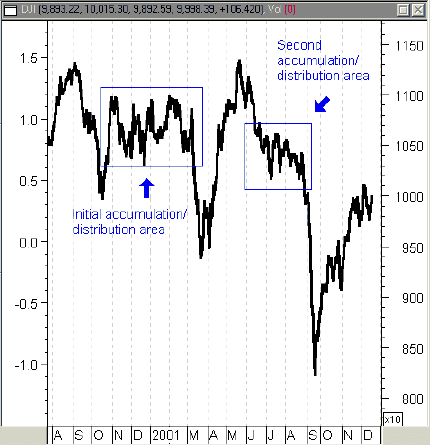
LINES AT WORKAn example of Dow lines at work can be seen in Figure 1. In particular, the lines that developed as the Dow Jones Industrial Average (DJIA) slipped from bull market to bear market are worth noting. After suffering a dramatic decline in the late summer and early fall of 2000, the Dow Jones industrials slipped into a trading range after the October 2000 rally. This trading range, roughly between 11,100 and 10,400, continued until March 2001, creating a classic line in the Dow theory sense. Variation during the period was within the 5% range, thus making it likely for a Dow line to develop, according to Dow theory.
Figure 1: A pair of Dow lines in the DJIA helped usher in the bear market of 2001.
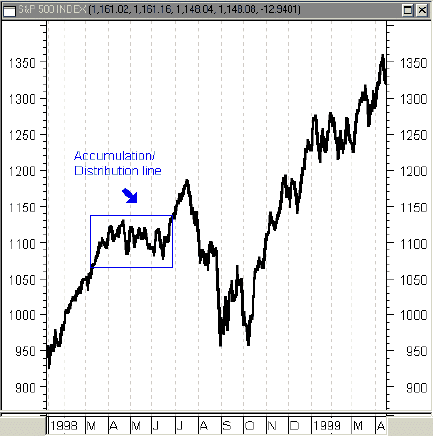
A second, briefer, line developed in the wake of the May 2001 highs. It began in mid-June, with a top at about 1070, and continued until August, with a low of 1010. This is well within the 5% range that Dow theory posits for Dow lines and, coming so soon after the May peak, looks to have been a line in which smarter, stronger hands were likely selling shares to less-informed, weaker hands. Although the September 2001 declines make it easy to say that those who were long going into the month were less informed, the weakness of the market prior to that time and the presence of both buying and selling during the June-August line suggest there were those less optimistic on the market's near-term prospects. And given the declines, it seems reasonable to call these latter investors and traders both smarter and stronger. Finally, the line that developed in the spring of 1997 in the Standard & Poor's 500, while not necessarily appearing so at the time, was a major accumulation/distribution area during the late stages of the 1990s bull market. Arguably, given the way the S&P 500 traded after the summer of 1998 — the bust in the autumn of 1998 and the dotcom bubble of 1999 — this Dow line marked a period of accumulation and distribution from stronger hands to weaker ones (Figure 2). For one, the S&P 500 at the beginning of 1995 was at about 450. By the beginning of 1998, the S&P 500 had more than doubled to 975. By the time the line began to form in the spring of 1998, the S&P 500 had increased by 130% from the beginning of 1995.
Figure 2: This Dow line in early 1998 preceded the market collapse in the autumn as well as the dotcom bubble of 1999.
This kind of advance — the correction in 1997 notwithstanding — suggests an overextended market. This probably encouraged many to pare back on their stock holdings for fear the S&P 500's three-year, 130% return had started to crumble.
LINES 'N' COMPANYIt should be stressed that Dow lines can be difficult to read. Is a line part of a continuation in an uptrend, or is it signaling a near-term reversal? There is little in the Dow line itself that provides a sure clue as to whether price action leaving the line will go up or down. However, when used in concert with other chart patterns, indicators, and other statistical measures, Dow lines can reveal worthwhile information about the trend's future action. The length of the trend leading into a Dow line, for example, can help an investor or trader decide whether the line is forming in a mature trend that may be due for a correction or reversal, or forming in a young, nascent trend, for which a Dow line may serve as a major area of accumulation to power a renewed drive. Uptrends and downtrends are, with good reason, the lifeblood of the markets, and it's not surprising that the bulk of traders' profits are made when the markets trend strongly upward or downward — hence the trading maxim, "The trend is your friend." However, the markets spend more time between trends than in them, and much of that in-between time is spent forming lines. Knowing what lines are, what they look like, and how to profit from them is key not only to making money when the market is not trending, but also in preparing for potentially profitable trades once the market breaks its line and begins moving, upward or downward, again.
David Penn is a Staff Writer for Stocks & Commodities.
SUGGESTED READINGSheimo, Michael D [1989]. Dow Theory Redux, Probus Publishing.
Charts: Metastock for Windows Current and past articles from Working Money, the Investors' Magazine, may be found online at Working-Money.com. |
Technical Writer for Technical Analysis of STOCKS & COMMODITIES magazine, Working-Money.com, and Traders.com Advantage.
| Title: | Traders.com Technical Writer |
| Company: | Technical Analysis, Inc. |
| Address: | 4757 California Avenue SW |
| Seattle, WA 98116 | |
| Phone # for sales: | 206 938 0570 |
| Fax: | 206 938 1307 |
| Website: | www.traders.com |
| E-mail address: | DPenn@traders.com |
Traders' Resource Links | |
| Charting the Stock Market: The Wyckoff Method -- Books | |
| Working-Money.com -- Online Trading Services | |
| Traders.com Advantage -- Online Trading Services | |
| Technical Analysis of Stocks & Commodities -- Publications and Newsletters | |
| Working Money, at Working-Money.com -- Publications and Newsletters | |
| Traders.com Advantage -- Publications and Newsletters | |
| Professional Traders Starter Kit -- Software | |
PRINT THIS ARTICLE

Request Information From Our Sponsors
- StockCharts.com, Inc.
- Candle Patterns
- Candlestick Charting Explained
- Intermarket Technical Analysis
- John Murphy on Chart Analysis
- John Murphy's Chart Pattern Recognition
- John Murphy's Market Message
- MurphyExplainsMarketAnalysis-Intermarket Analysis
- MurphyExplainsMarketAnalysis-Visual Analysis
- StockCharts.com
- Technical Analysis of the Financial Markets
- The Visual Investor
- VectorVest, Inc.
- Executive Premier Workshop
- One-Day Options Course
- OptionsPro
- Retirement Income Workshop
- Sure-Fire Trading Systems (VectorVest, Inc.)
- Trading as a Business Workshop
- VectorVest 7 EOD
- VectorVest 7 RealTime/IntraDay
- VectorVest AutoTester
- VectorVest Educational Services
- VectorVest OnLine
- VectorVest Options Analyzer
- VectorVest ProGraphics v6.0
- VectorVest ProTrader 7
- VectorVest RealTime Derby Tool
- VectorVest Simulator
- VectorVest Variator
- VectorVest Watchdog