HOT TOPICS LIST
- Strategies
- Stocks
- Buy
- Investing
- Brokers
- Psychology
- Interviews
- Accumulate
- Sell
- Hold
- Spotlight
- Websites
- Candlestick Corner
- Gold & Metals
- Options Trading
LIST OF TOPICS
THE CHARTIST
Stay In The Market With Stop-And-Reverse
01/15/02 04:40:43 PM PSTby Rudy Teseo
If you hate being out of the market, you should take a look at this system.
| The parabolic time/price system indicator was developed by J. Welles Wilder. Often referred to as parabolic SAR or simply SAR (for "stop and reverse"), the term comes from its appearance as a parabola when viewed on a chart. A SuperCharts help file describes SAR as "a system designed to allow more leeway or tolerance for contratrend price fluctuation early in a new trade, and then to progressively tighten a protective trailing stop order as the trend matures." The indicator is a stop-setting entry and exit trading system designed to keep the investor in the market at all times. The idea is that if a trade is not continually producing profits, then it should be liquidated. But instead of waiting for the price to bottom and then re-entering with a long position, why not take advantage of the profit opportunities on the way down?
USING SARThe SAR indicator displays as a series of dots one dot for each price bar, regardless of the time frame being used. In a long position the dots are below the price, and in a short position the dots are above the price. Using SAR begins with exiting your long position and entering a short position when the price falls below the SAR, and the dots switch from below to above the price. Likewise, you exit your short position and enter a long position when the price crosses above the SAR, and the dots switch from above to below the price. (If you have a very sophisticated charting program, it may be possible to have the trades entered automatically for you if you have the guts to follow any system blindly.)
CALCULATING SARThe formulas used to calculate this indicator are:
SARb = SARp + AF(H-SARp)
SARs = SARp + AF(L-SARp)
Where:
SARb = The long-side sell stop price, at which you exit long and enter short
SARp = The previous bar's SAR
H = The new highest price, since the current long trade was opened on a stop buy order
L = The new lowest price, since the current short trade was opened on a stop sell order
The SAR = The value returned by the parabolic function of your program.
AF stands for an acceleration factor that begins at 0.02 when the trade is opened, and increases by 0.02 each period that the price rises toward the highest level (H) since the trade was opened. The SAR moves up each period regardless of the price action. Thus, as the price starts to flatten, the price approaches the SAR until it crosses and creates the switch signal. You may anticipate the impending switch by monitoring the rate of change of the distance between the price and the SAR. You can make your trades several bars before the actual crossing and thus pick up a few extra points. Naturally, you will not use this indicator by itself. The first rule in technical analysis: A good money management system is more important than a trading system. The second rule: Never use an indicator without confirmation. In the following charts, I have used the directional movement index in the form of DMIp (plus) and DMIm (minus). More often than not, DMIp crosses above DMIm within a day or two of the SAR going long.
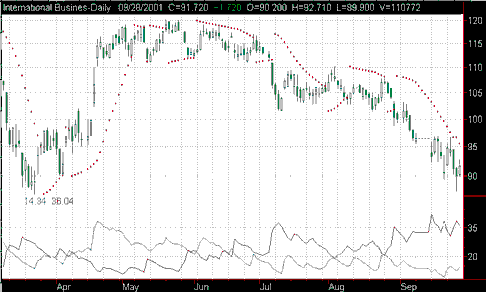
SOME EXAMPLESIn Figure 1 you can see a display of the SAR on a chart of International Business Machines (IBM). Note the short position as the market was falling on its way to the low of April 4, 2001. On April 9, IBM went long, coincident with DMIp (green) crossing above DMIm (red). Prior to this date you will see some whipsawing between March 26 and April 6. (No system is perfect!) The four bars flattened out before the SAR went short on May 7, foretelling a closure with the SAR. You could have gotten out at 118 instead of at 111 if you had heeded this warning.
Figure 1: International Business Machines (IBM). Here four bars were relatively flat, signaling a reversal in trend.
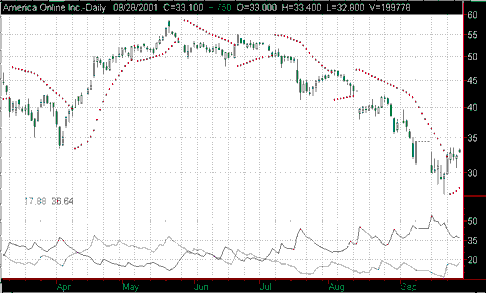
Figure 2 displays a chart of AOL Time Warner (AOL), with SAR and DMI. AOL went long one day after IBM, and the DMI followed two days later. SAR went short on May 29 and DMI also went south three days later. Again, several bars before the SAR went short, we saw the price approaching the SAR rather than moving away from it, signaling a closure with the SAR.
Figure 2: AOL Time Warner. Using the SAR with the DMI triggers some worthwhile signals.
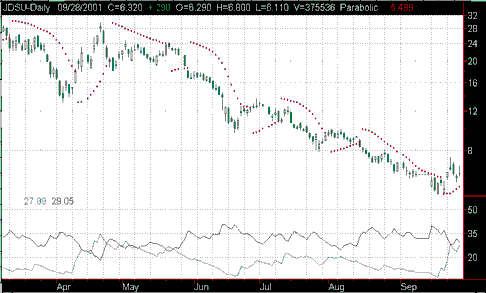
Figure 3 displays a chart of JDS Uniphase (JDSU) with SAR. This is a good example of how the SAR can keep you out of trouble. JDSU is the kind of stock many traders would jump into as soon as the market appeared to be reversing. But after an initial long position on April 11 followed by DMI crossing six days later, you can see that SAR would have kept you out of any sustained long position.
Figure 3: JDS Uniphase (JDSU). Here's another example of how SAR can keep you out of trouble.
Parabolic SAR is not a panacea, of course, but if you haven't been using this unique tool, you owe it to yourself to at least try some paper-trading with it.
Rudy Teseo is a retired communications and computer consultant. He has also taught courses in investing, technical analysis, and options trading. You can e-mail him at rftess@juno.com.
SUGGESTED READINGWilder, J. Welles [1978]. New Concepts In Technical Trading Systems, Trend Research. Current and past articles from Working Money, The Investors' Magazine, can be found online at Working-Money.com. |
Rudy Teseo is a private investor who trades stocks, options, and currencies. He has taught classes in technical analysis and option trading. He may be reached at rftess@optonline.net.
| E-mail address: | rftess@optonline.net |
PRINT THIS ARTICLE

Request Information From Our Sponsors
- StockCharts.com, Inc.
- Candle Patterns
- Candlestick Charting Explained
- Intermarket Technical Analysis
- John Murphy on Chart Analysis
- John Murphy's Chart Pattern Recognition
- John Murphy's Market Message
- MurphyExplainsMarketAnalysis-Intermarket Analysis
- MurphyExplainsMarketAnalysis-Visual Analysis
- StockCharts.com
- Technical Analysis of the Financial Markets
- The Visual Investor
- VectorVest, Inc.
- Executive Premier Workshop
- One-Day Options Course
- OptionsPro
- Retirement Income Workshop
- Sure-Fire Trading Systems (VectorVest, Inc.)
- Trading as a Business Workshop
- VectorVest 7 EOD
- VectorVest 7 RealTime/IntraDay
- VectorVest AutoTester
- VectorVest Educational Services
- VectorVest OnLine
- VectorVest Options Analyzer
- VectorVest ProGraphics v6.0
- VectorVest ProTrader 7
- VectorVest RealTime Derby Tool
- VectorVest Simulator
- VectorVest Variator
- VectorVest Watchdog


