

HOT TOPICS LIST
- Strategies
- Stocks
- Buy
- Investing
- Brokers
- Psychology
- Interviews
- Accumulate
- Sell
- Hold
- Spotlight
- Websites
- Candlestick Corner
- Gold & Metals
- Options Trading
LIST OF TOPICS
TRADER'S NOTEBOOK
Commodity Channel Index
02/05/02 01:44:17 PM PSTby Amy Wu
Is a new trend beginning?
| The consensus is that the markets have hit a bottom and are starting to show signs of recovery. To find out whether this is true, you can apply the commodity channel index (CCI), an indicator useful for determining the beginning and end of a trend. Introduced by Donald Lambert in 1980, the commodity channel index is a price momentum indicator that measures the degree of variance of a security price from its statistical mean. Although originally developed for trading commodities, the CCI can be used just as easily on stocks or any other type of security.
CALCULATIONThe CCI is relatively simple to calculate, requiring five easy steps.
1 Add each period's high, low, and close and divide this sum by 3. (Here, you are looking at the mean price for each day, instead of the usual practice of using just the closing price.)
The parameter you select for the lookback period can vary. Most technical analysis software includes the CCI as a built-in indicator and gives you the flexibility to change the lookback period. You don't want to use too short a period, since that will cause whipsaws. However, using a period that is too long will result in missed signals.
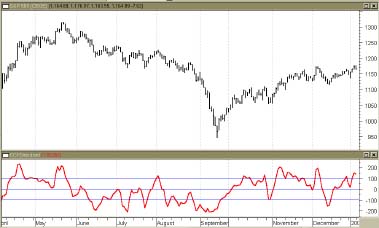
USING THE CCIThe CCI basically looks at prices relative to the average price. If the CCI of a security is high, prices are higher relative to the average price. Likewise, if the CCI of a security is low, prices are lower relative to the average price. Usually, the CCI falls within the +/-100 range. Whenever the index moves beyond this range it suggests that the movements are no longer random, creating trading opportunities. Hence, if the CCI rises above +100 it means that you should consider going long, and when it falls below +100 you should exit your position. Conversely, when the CCI falls below -100 it means you should consider shorting a position, and when it moves above the -100 point you should cover your short. Figure 1 displays the CCI, using a 20-period parameter applied to the Standard & Poor's 500 index. The CCI is hovering over the +100 level — an indication that the downward direction the markets have been in since the spring of 2000 may be reversing. This is a positive sign indeed and one that we can only hope will continue to stay at this level for a while longer.
CONCLUSIONThe CCI is a useful indicator for detecting the start and end of a trend, but beyond that, its usefulness is limited. Once you know a trend has begun, it's necessary for you to apply an indicator that works well during trends. But at times of uncertainty the CCI can prove helpful, especially when applied to the broader indexes.
Amy Wu is a student at Princeton University. MetaStock (Equis International); ESignal (data)
Current and past articles from Working Money, The Investors' Magazine, can be found at Working-Money.com. |
Amy Wu is a student at Princeton University, majoring in economics and financial engineering.
| Title: | Editorial, Intern |
| Company: | Technical Analysis, Inc. |
| Address: | 4757 California AVE SW |
| Seattle, WA 98116 | |
| Phone # for sales: | 206-938-0570 |
| Fax: | 206-938-1307 |
| Website: | www.traders.com |
| E-mail address: | AWu@traders.com |
Traders' Resource Links | |
| Charting the Stock Market: The Wyckoff Method -- Books | |
| Working-Money.com -- Online Trading Services | |
| Traders.com Advantage -- Online Trading Services | |
| Technical Analysis of Stocks & Commodities -- Publications and Newsletters | |
| Working Money, at Working-Money.com -- Publications and Newsletters | |
| Traders.com Advantage -- Publications and Newsletters | |
| Professional Traders Starter Kit -- Software | |
PRINT THIS ARTICLE

Request Information From Our Sponsors
- StockCharts.com, Inc.
- Candle Patterns
- Candlestick Charting Explained
- Intermarket Technical Analysis
- John Murphy on Chart Analysis
- John Murphy's Chart Pattern Recognition
- John Murphy's Market Message
- MurphyExplainsMarketAnalysis-Intermarket Analysis
- MurphyExplainsMarketAnalysis-Visual Analysis
- StockCharts.com
- Technical Analysis of the Financial Markets
- The Visual Investor
- VectorVest, Inc.
- Executive Premier Workshop
- One-Day Options Course
- OptionsPro
- Retirement Income Workshop
- Sure-Fire Trading Systems (VectorVest, Inc.)
- Trading as a Business Workshop
- VectorVest 7 EOD
- VectorVest 7 RealTime/IntraDay
- VectorVest AutoTester
- VectorVest Educational Services
- VectorVest OnLine
- VectorVest Options Analyzer
- VectorVest ProGraphics v6.0
- VectorVest ProTrader 7
- VectorVest RealTime Derby Tool
- VectorVest Simulator
- VectorVest Variator
- VectorVest Watchdog