HOT TOPICS LIST
- Strategies
- Stocks
- Buy
- Investing
- Brokers
- Psychology
- Interviews
- Accumulate
- Sell
- Hold
- Spotlight
- Websites
- Candlestick Corner
- Gold & Metals
- Options Trading
LIST OF TOPICS
CANDLESTICK CORNER
When Candlesticks Cast Long Shadows
03/12/02 04:12:01 PM PSTby Sharon Yamanaka
Not all candlestick patterns are statistically significant. Some, such as the various stars, hammers, and hanging men, occur too frequently, in all possible places: in the beginning, middle, and end of stocks trading in trends and ranges. But sometimes even these candlestick patterns can be useful.
| Suddenly, everybody was my friend. I had just bought some Krispy Kremes — not the stock, but the doughnuts themselves — and was being mobbed as I walked through the Las Vegas airport with the half-empty box. Even the woman at the Ethel M's counter looked as though she would trade a couple of truffles for a raspberry glazed. Who would have ever thought you could scalp a doughnut? And with a product like that, who can resist the stock? This was the beginning of my interest in Krispy Kreme, and in a roundabout way, this is how you can use the hammer, hanging man, and spinning top candlestick patterns — formations with long shadows, short bodies, and little statistical significance — to your advantage.
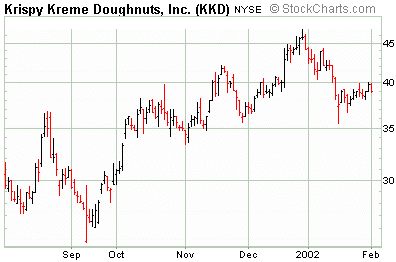
THE SETUPAfter finding a stock — in this case, Krispy Kreme (KKD) — that seemed fundamentally sound, I applied various methods of technical analysis to see if it was tradable. Figure 1 displays a basic daily bar chart of KKD.
Figure 1: KKD six-month daily chart. To analyze this chart, I:
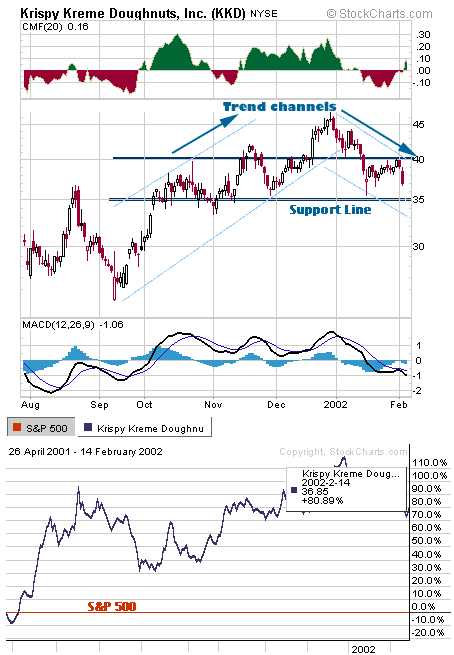
1 Converted it into a candlestick chart. Figure 2 displays the setup I used.
Figure 2: KKD analysis with the Chaikin oscillator, followed by the daily candlestick price chart, overlaid with trend channels and a support line at 35, MACD, and a performance chart comparing the S&P 500 with KKD. KKD has outperformed the S&P by 80.89%.
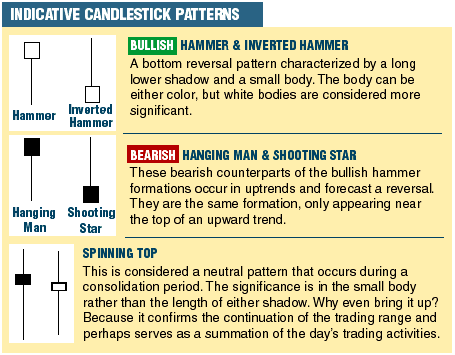
IS IT TRADABLE?Is it tradable? It certainly looks that way, and according to the MACD, which is showing oversold, it will soon be a good time to enter a long position. This stock rises and falls in trends, with money flowing in and out in a predictable pattern. It has a strong support line at $35 and I have decided that I want to buy in the next time price approaches that level. It's now in a downtrend after peaking at an all-time high of $47. The downtrend may be the result of profit-taking and an inflated price/earnings ratio that has gone over 110. Over the past three years, that has been a consistent pattern with this stock: the P/E hovers around 100 most of the time, keeping the stock price inflated. If anything happens (such as bad news pertaining to the stock or the overall economy) and KKD starts going down, it could go down a long, long way. I am going to watch the stock and buy in around $35. I 'd prefer to get in as the stock reverses from its current downtrend. At this point, with everything set up, I can use candlestick patterns to track day-to-day changes. Figure 3 shows candlestick patterns that feature long shadows and short bodies and are single-day formations. These are interesting because they occur too frequently to be significant, especially if you are using a statistical guideline or computer-generated system, but every now and then they will form at some crucial point and serve as an alert to a sudden change in a stock's value.
Figure 3: Like many single-candlestick patterns, these require second-day confirmation, and are therefore more indicative than predictive. The formations in this chart show every combination of long shadows with short bodies.
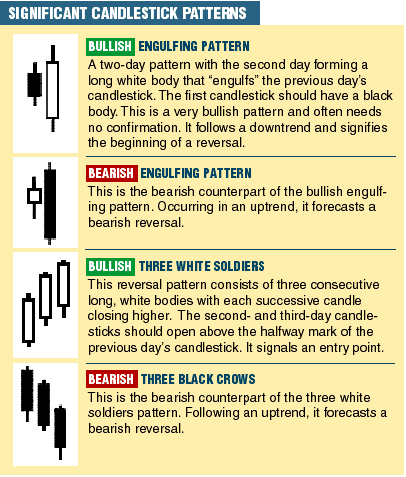
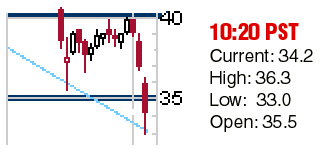
Figure 4: These patterns are considered strong enough to need no verification. Significant formations tend to be two- and three-day formations. IF I HAD A HAMMER. . .On February 5, 2002, I looked at the chart of KKD and found a sudden drop in the stock price. It had dipped below the all-important $35 support level. I first checked on the stock at 10:20 PST, and saw this daily candlestick forming:
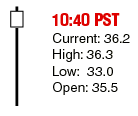
Because the stock dropped suddenly, independently of the overall market movement, I checked the news releases to see if there was anything relevant to KKD. There was. The recent issue of Forbes had pronounced the financing of Krispy Kreme's new leasing agreement for a manufacturing and distributing facility in Effingham, IL, to be questionable. In the post-Enron climate, the company's synthetic lease was called into question, and as a result, the stock took a sudden plunge. (A synthetic lease is a debt instrument that keeps real estate from showing up on a financial statement.) By the time I checked the report, the stock had already bottomed out and seemed to be headed upward. At 10:40 it looked like this:
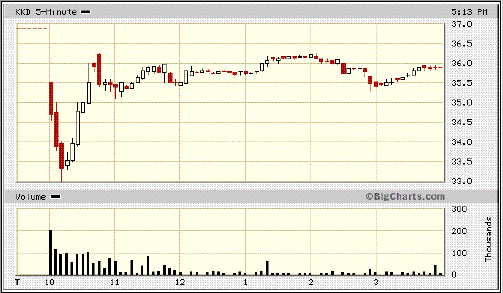
A nice inverted hammer was in the process of forming. The crisis was over, and further press releases called the synthetic lease a standard business practice. The five-minute chart of KKD for that day showing the sudden selloff and rebound of the stock can be seen in Figure 5.
Figure 5: KKD five-minute daily chart for February 5, 2002. Notice all of the hammers, hanging men, and spinning tops that have formed. Most of them have no predictive value. In his book CandlePower, Gregory Morris gives this explanation of the circumstances and psychology behind hammer patterns:
The market has been in a downtrend, so there is an air of bearishness. The market opens and then sells off sharply. However, the sell-off is abated and the market returns to, or near its high for the day. The failure of the market to continue the selling reduces the bearish sentiment, and most traders will be uneasy with any bearish positions they might have. If the close is above the open, causing a white body, the situation is even better for the bulls. Confirmation would be a higher open with yet a still-higher close on the next trading day.
In general terms, this describes perfectly what happened to KKD. When you put in the specifics, these indicative, nonsignificant candlestick patterns suddenly make a lot of sense. I waited for the following day's confirming pattern to buy into the stock. Had I been quicker, I might have bought in on the previous day's long shadow, but it was less risky to buy later.
FOLLOW-UPTwo weeks later, the stock was still above the $35 support line, and a couple of promising candlestick formations seemed to be showing the strength of this support and indicating a strong upward move (Figure 6).
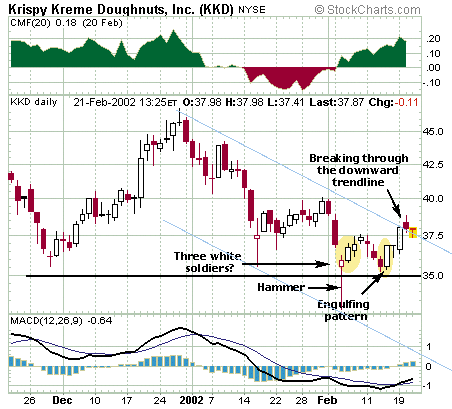
Figure 6: KKD daily chart showing very positive technical signs. The huge negative for this stock is its inflated P/E ratio.
The February 5th hammer pattern eventually became the first candlestick in a three white soldiers pattern. Figure 6 illustrates this pattern, as well as a few other significant patterns. Arguably, the candlesticks in KKD are pretty wimpy soldiers, but the stock did go up not only three, but four consecutive days. It went down again before almost hitting the $35 support level, but again rebounded strongly with an engulfing pattern. Later, on February 19, the stock broke through the downward trendline and seemed to settle into a consolidation pattern.
CONCLUSIONLong-shadowed candlesticks can be alerts for certain event-related changes in a stock's price. Seeing the hammer form in KKD gave me some basis to buy the stock, even though it had been in a downtrend and its finances were being questioned. That it bounced back so quickly showed me it was a temporary casualty of the Enron scare and there was nothing fundamentally wrong with the stock.
Please send all Krispy Kreme anecdotes and any other coments to Sharon Yamanaka at SYamanaka@Traders.com.
SUGGESTED READINGMorris, Greg L. [1992]. CandlePower: Advanced Candlestick Pattern Recognition And Filtering Techniques For Trading Stocks And Futures, Probus Professional Publishing._____ [1995]. Candlestick Charting Explained: Timeless Techniques For Trading Stocks And Futures, Irwin Professional Publishing. BigCharts, StockCharts.com
Current and past articles from Working Money, The Investors' Magazine, can be found at Working-Money.com.
|
| Title: | Staff Writer |
| Company: | Technical Analysis, Inc. |
| Address: | 4757 California AVE SW |
| Seattle, WA 98116 | |
| Phone # for sales: | 206 938 0570 |
| Fax: | 206 938 1307 |
| Website: | www.Working-Money.com |
| E-mail address: | syamanaka@traders.com |
Traders' Resource Links | |
| Charting the Stock Market: The Wyckoff Method -- Books | |
| Working-Money.com -- Online Trading Services | |
| Traders.com Advantage -- Online Trading Services | |
| Technical Analysis of Stocks & Commodities -- Publications and Newsletters | |
| Working Money, at Working-Money.com -- Publications and Newsletters | |
| Traders.com Advantage -- Publications and Newsletters | |
| Professional Traders Starter Kit -- Software | |
PRINT THIS ARTICLE

|

Request Information From Our Sponsors
- StockCharts.com, Inc.
- Candle Patterns
- Candlestick Charting Explained
- Intermarket Technical Analysis
- John Murphy on Chart Analysis
- John Murphy's Chart Pattern Recognition
- John Murphy's Market Message
- MurphyExplainsMarketAnalysis-Intermarket Analysis
- MurphyExplainsMarketAnalysis-Visual Analysis
- StockCharts.com
- Technical Analysis of the Financial Markets
- The Visual Investor
- VectorVest, Inc.
- Executive Premier Workshop
- One-Day Options Course
- OptionsPro
- Retirement Income Workshop
- Sure-Fire Trading Systems (VectorVest, Inc.)
- Trading as a Business Workshop
- VectorVest 7 EOD
- VectorVest 7 RealTime/IntraDay
- VectorVest AutoTester
- VectorVest Educational Services
- VectorVest OnLine
- VectorVest Options Analyzer
- VectorVest ProGraphics v6.0
- VectorVest ProTrader 7
- VectorVest RealTime Derby Tool
- VectorVest Simulator
- VectorVest Variator
- VectorVest Watchdog

