HOT TOPICS LIST
- Strategies
- Stocks
- Buy
- Investing
- Brokers
- Psychology
- Interviews
- Accumulate
- Sell
- Hold
- Spotlight
- Websites
- Candlestick Corner
- Gold & Metals
- Options Trading
LIST OF TOPICS
DOW THEORY
How Dow Theory Works
03/12/02 04:36:27 PM PSTby Andrew Hetherington
What is Dow theory, anyway?
| The Dow Jones Industrial Average (DJIA) is an index of the price fluctuations and volume for 30 blue-chip equities. The DJIA's companion index is the Dow Jones Transportation Average (DJTA), which is made up of freight, airline, courier, trucking, and rail equities. According to Dow theory, the DJTA confirms the movements of the DJIA. This confirmation usually lags after the DJIA has already completed its move. However, there are times when the two move almost in tandem. I like to chart these price movements on a bar chart with the volume at the bottom, while others prefer to use a line-on-close style of chart. (True Dow theory requires the line on close, but I've become accustomed to using the bar charts.) Once you have constructed the graph and charted the daily or weekly movements of the indexes, you are ready to interpret their movements to determine the direction of the markets. This interpretation of charts is the basis of classic Dow theory.
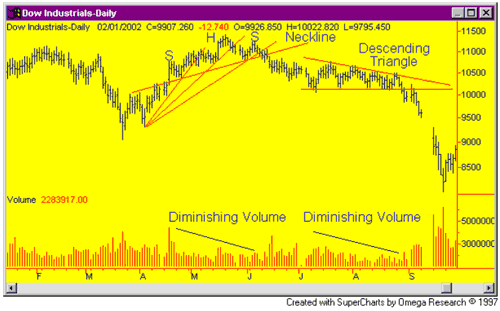
PATTERN RECOGNITIONChart patterns come in a variety of shapes and sizes. There are head and shoulders patterns, wedges, triangles, flags, pennants, rectangles, double or triple bottoms and tops, saucers, bowls, scallops, diamonds, broadening formations — and more. The horrifying events of September 11, 2001, sent the indexes tumbling. For many Dow theorists there had been warning of underlying weakness in the market for some time, so September 11 came as a shock to an already faltering stock market. Looking at Figures 1 and 2, you can see in the chart of the DJIA that a head and shoulders top pattern formed between April 18 and June 11, 2001. If you apply fanlines to this chart, you can see that prices also broke on the downside after breaking the third fanline. The breaking of both the neckline and the fanline as of June 11, 2001, was enough to signal the underlying weakness in the market and prompt traders to play the market short. The chart then went on to form a two-month descending triangle with diminishing volume. The formation of the descending triangle gave further warning of an upcoming drop (see Figure 1). We have two bearish patterns, one after the other, that gave every indication of weakness. That would have predicted a further drop in the indexes with or without the events of September 11.
Figure 1: Dow Jones Industrial Average (DJIA). The formation of a head and shoulders pattern and a break of the third fanline followed by a descending triangle implies there is underlying weakness in the market.
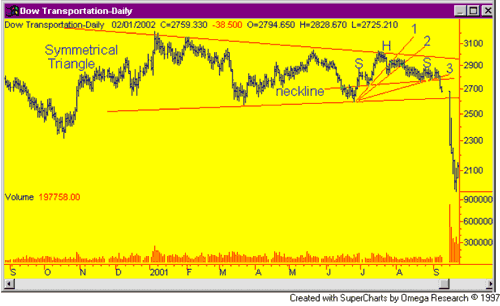
The transports confirm this underlying weakness (see Figure 2). While the industrials were forming bearish patterns, the transports were making bearish patterns of their own. A 10-month symmetrical triangle — not always bearish — formed, which, because of the weakness in the DJIA, would have signaled a possible downward move. Toward the end of the symmetrical triangle, a small two-month head and shoulders top pattern formed and broke on the downside after breaking the third fanline. This took place on September 7, 2001. Even if you were not bearish up until that time, Dow theory would surely have prompted you to become bearish very quickly with this confirmation.
Figure 2: Dow Jones Transportation Index. Here again, you see the formation of a head and shoulders pattern and a break in the third fanline. Together, they are a signal to close out long positions and open short ones.
THE CATALYST?It would have been impossible for anyone to know what the catalyst would be for the ensuing drop in the indexes, since it could have been a great many things. Dow theorists don't try to explain or predict events; instead, they focus on which direction the markets are going to go. However, a look at these charts would have prompted you to play the market short by September 7, 2001, if you had been long since March 22, 2001 (see Figure 1), which is when the DJIA reversed direction from down to up. Then it reversed again on June 11, 2001, and once again on September 21, prompting Dow theorists to go long once more. The transports (Figure 2) and the industrials both dropped hard and fast on the markets' reopening on September 17, 2001, but by September 21, they had reversed once again. As of this writing (at the end of February 2002), both indexes are long and will be heading higher for a while. Coincidentally, the Nasdaq went through similar movements. It had formed a small head and shoulders top and a small descending triangle at the same time those patterns formed on the DJIA and DJTA charts. The bearish head and shoulders patterns both broke on the downside virtually simultaneously on June 11, 2001. Then the descending triangle on the Nasdaq broke down and pulled back on August 28, while the DJIA just started to unravel from the descending triangle. There was ample time to enter short positions or sell long ones before the big drops that were about to take place. The big selloff ensured that all the weak hands had folded their cards. A strong rally was inevitable.
WEAKNESS IN DOW THEORYCritics of the Dow theory say that it gives lagging signals, resulting in smaller profits or bigger losses, since it takes a while to determine the trend of the index. This is true in some cases, but a seasoned technical analyst can anticipate trend direction while piecing the puzzle together. Take a look at the following examples. The DJIA had signaled a four-month ascending triangle that had broken on the downside and pulled back on March 9, 2001. The high on that day was 10,874, dropping over the next nine days to a low of 9047. Although ascending triangles tend to be bullish, in this case it had clearly broken on the downside. This down direction only lasted nine days, but was a large move in terms of percentages (16.8%) — a hard and fast drop that caught most by surprise. Another major shift came on July 31, 2001. The DJIA formed a four-month descending triangle — a pattern that tends to be bearish, but not always — that broke the topside. This sizable move from 10,374 to a high of 11,518 (11%) was the last of seven direction changes in 18 months.
CONCLUSIONAlthough chart interpretation doesn't provide all the answers, it gives enough clues to anticipate the direction of a market. You may have to look at thousands of charts before becoming proficient at their interpretation, but it is well worth the effort.
Andrew Hetherington is a classic Dow theorist who trades as a pure technician, using pattern recognition.
SUGGESTED READINGEdwards, Robert D., and John Magee [1997]. Technical Analysis Of Stock Trends, 7th ed., Amacom.
SuperCharts (TradeStation Technologies)
Current and past articles from Working Money, The Investors' Magazine, can be found at Working-Money.com.
|
PRINT THIS ARTICLE

Request Information From Our Sponsors
- VectorVest, Inc.
- Executive Premier Workshop
- One-Day Options Course
- OptionsPro
- Retirement Income Workshop
- Sure-Fire Trading Systems (VectorVest, Inc.)
- Trading as a Business Workshop
- VectorVest 7 EOD
- VectorVest 7 RealTime/IntraDay
- VectorVest AutoTester
- VectorVest Educational Services
- VectorVest OnLine
- VectorVest Options Analyzer
- VectorVest ProGraphics v6.0
- VectorVest ProTrader 7
- VectorVest RealTime Derby Tool
- VectorVest Simulator
- VectorVest Variator
- VectorVest Watchdog
- StockCharts.com, Inc.
- Candle Patterns
- Candlestick Charting Explained
- Intermarket Technical Analysis
- John Murphy on Chart Analysis
- John Murphy's Chart Pattern Recognition
- John Murphy's Market Message
- MurphyExplainsMarketAnalysis-Intermarket Analysis
- MurphyExplainsMarketAnalysis-Visual Analysis
- StockCharts.com
- Technical Analysis of the Financial Markets
- The Visual Investor


