HOT TOPICS LIST
- Strategies
- Stocks
- Buy
- Investing
- Brokers
- Psychology
- Interviews
- Accumulate
- Sell
- Hold
- Spotlight
- Websites
- Candlestick Corner
- Gold & Metals
- Options Trading
LIST OF TOPICS
MARKET UPDATE
Fuzzy Math Redux
03/19/02 01:53:56 PM PSTby David Penn
Is this what bear markets sound like?
| Every secular bear market seems to have its own distinct style. There was the Depression era/Smoot-Hawley/"Hot War" secular bear market from 1929 to 1947 . . . and the inflationary/Great Society/"Cold War" secular bear market from 1966 to 1982. Now it seems there is a new secular bear market that, beginning with the implosion of the dotcom boom and accelerating with the shocking violence of the World Trade Center/Pentagon terrorist attacks of September 11, 2001, may ultimately be characterized by historians in two words: Fuzzy Math. Secular bear markets, periods of a decade or longer in which the major market averages make no significant new highs, are marked by more than just the flailing of a stock market that, like the old woman in the infamous commercial, has fallen and can't get up. Secular bears emerge in a noxious cloud of pessimism, doubt, and cynicism about the financial markets. Big business increasingly finds itself the culprit for all manner of real and imagined crimes against humanity, and government asserts itself as a purer, more reliable guardian of the public trust. Corporate protectionism and minimum-wage legislation, for example, thrive in this environment — as do antitrust crusades and the timorous calls for tax increases (the guardian, after all, must be fed). In such a scenario, the Enron accounting scandal and its myriad discontents are the perfect foil. That even honest accounting is a mystery to average investors makes those investors all the more vulnerable to mistakes as they evaluate what will likely be a long series of accounting disasters in companies across the spectrum. It is no surprise that these accounting "blowups" first and most destructively occurred in the areas of energy trading (in which Enron attempted to paddle up a deflationary stream), and telecommunications (where federal regulation, overcapacity, and the consequences of leverage in a deflationary economy doomed companies like Global Crossing). William Greider, writing in Secrets Of The Temple: How The Federal Reserve Runs The Country, asks a question that remains relevant today as more and more Americans put their faith and futures in the hands of mutual fund managers and stockbrokers, who in turn rely on companies to at least tell the truth. Greider wrote: "How could such a system possibly work? Why didn't it collapse and produce social disaster? The short simple explanation was: trust. People trusted the banks (and, by extension, the Federal Reserve). They believed, perhaps not even knowing the actual mechanics, that bankers would use this magic prudently." Twenty years later, Greider's bankers are our accountants, and Enron is modern marketspeak for the worst kind of doubt, that terrible nagging fear that every fundamentally minded analyst, investor, or trader has that — to put it bluntly — a company is lying. So long as any atmosphere of doubt persists, trust, to say nothing of the blind faith that propelled stock markets in the late 1990s to unparalleled heights, will be impossible. This is not to say that there will not be opportunities, both in the indexes and in individual stocks, in the months to come. In fact, there is a compelling case for a bullish, countertrend rally in the Nasdaq in 2002. (See "The Nasdaq Bottom This Spring," Traders.com Advantage.) For all those willing to be active, this secular bear market may actually afford more opportunities than passive investing in a secular bull market. But for diehard buy-and-holders, the stock markets are likely to be rough riding for the foreseeable future.
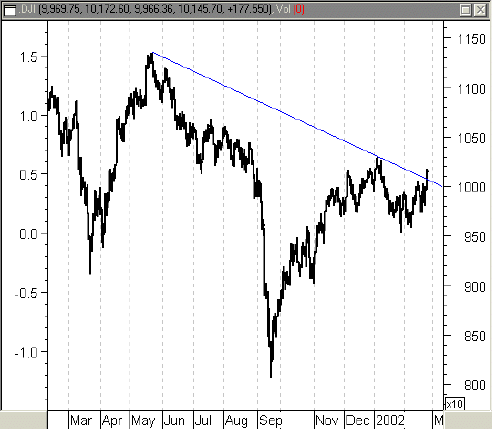
DOW UNDAUNTEDFor many, the blue-chip stocks of the Dow Jones Industrial Average (DJIA) were the last places for bulls to hide. With the Nasdaq moving lower for seven consecutive weeks to start off 2002 (an apparently mysterious phenomenon that went almost without comment among those on the economic recovery watch), the Dow industrials have actually been trending upward since the end of January, as can be seen in the chart displayed in Figure 1.
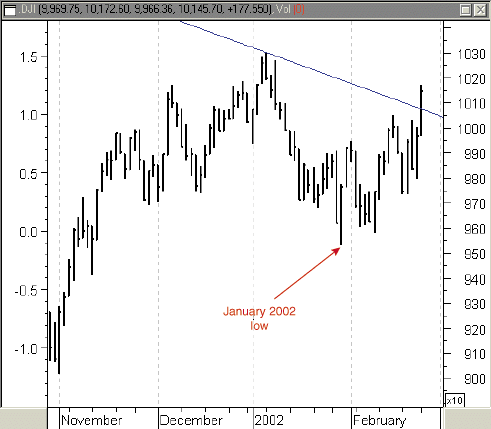
Figure 1: Dow Jones Industrial Average. From May 2001 to February 2002, the DJIA has been moving in a clear downtrend. February 14, incidentally, was also interesting in candlestick terms. The day is almost a doji (but for the slight thickness of the real body), which is a candlestick pattern that suggests a possible reversal at the end of a trend. In fact, the exceptional length of the upper and lower wicks is reminiscent of Steve Nison's "Ricksaw Man," or the long-legged doji. Here, the fat "Ricksaw Man" seemed to suggest that the four-day rally was in danger of reversing. That reversal did happen, in two bearish days that bookended the Presidents' Day holiday in 2002. The rally from that reversal (and subsequent correction) made a run on the January 2002 high. This rally has already broken out above the slope of the downward sloping trendline from the May 2001 peak, making the move on the January high the next important goal for the Dow industrials. Even if the DJIA fails to take out the January 2002 highs, there may be a silver lining. Not only do the January 2002 lows around 9530 (Figure 2) represent a source of support, but also the major downtrend line mentioned previously could provide support to a falling DJIA. If the rally stalls, bulls might take heart if the DJIA takes the trendline as its temporary resting place instead of retreating to the lower end of the channel.
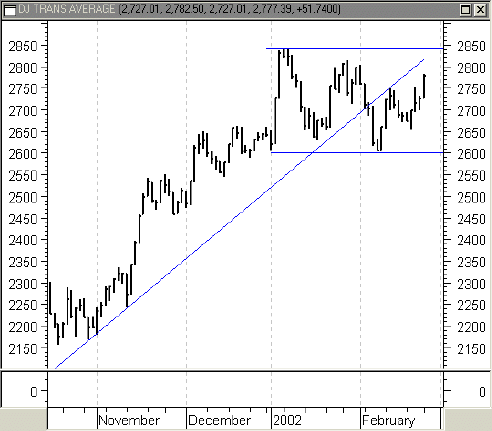
The Dow Jones transports, for their part, advanced with some strength in late February, taking out the high of the month on February 26 (Figure 3).
Figure 3: The real resistance level. A break above 2835 could imply a possible rally.
Although the transports have also been oscillating somewhat in a channel, the 2800 area — which is near the top of the consolidation range from 2620 to 2835 — represented significant resistance to the most recent transports rally that peaked on February 12. Should the transports continue on above 2800 and successfully test the real resistance area at 2835, then both the industrials and the transports may make a spring rally in blue chips (to say nothing of an economic recovery) all the more likely.
Staff writer David Penn may be reached at DPenn@Traders.com.
SUGGESTED READINGGreider, William [1989]. Secrets Of The Temple: How The Federal Reserve Runs The Country, reprint edition, Touchstone Books.Nison, Steve [1991]. Japanese Candlestick Charting Techniques, New York Institute of Finance. Penn, David [2002]. "The Nasdaq Bottom This Spring," Traders.com Advantage: February 19. MetaStock (Equis International)
Current and past articles from Working Money, The Investors' Magazine, can be found at Working-Money.com. |
Technical Writer for Technical Analysis of STOCKS & COMMODITIES magazine, Working-Money.com, and Traders.com Advantage.
| Title: | Traders.com Technical Writer |
| Company: | Technical Analysis, Inc. |
| Address: | 4757 California Avenue SW |
| Seattle, WA 98116 | |
| Phone # for sales: | 206 938 0570 |
| Fax: | 206 938 1307 |
| Website: | www.traders.com |
| E-mail address: | DPenn@traders.com |
Traders' Resource Links | |
| Charting the Stock Market: The Wyckoff Method -- Books | |
| Working-Money.com -- Online Trading Services | |
| Traders.com Advantage -- Online Trading Services | |
| Technical Analysis of Stocks & Commodities -- Publications and Newsletters | |
| Working Money, at Working-Money.com -- Publications and Newsletters | |
| Traders.com Advantage -- Publications and Newsletters | |
| Professional Traders Starter Kit -- Software | |
PRINT THIS ARTICLE

Request Information From Our Sponsors
- StockCharts.com, Inc.
- Candle Patterns
- Candlestick Charting Explained
- Intermarket Technical Analysis
- John Murphy on Chart Analysis
- John Murphy's Chart Pattern Recognition
- John Murphy's Market Message
- MurphyExplainsMarketAnalysis-Intermarket Analysis
- MurphyExplainsMarketAnalysis-Visual Analysis
- StockCharts.com
- Technical Analysis of the Financial Markets
- The Visual Investor
- VectorVest, Inc.
- Executive Premier Workshop
- One-Day Options Course
- OptionsPro
- Retirement Income Workshop
- Sure-Fire Trading Systems (VectorVest, Inc.)
- Trading as a Business Workshop
- VectorVest 7 EOD
- VectorVest 7 RealTime/IntraDay
- VectorVest AutoTester
- VectorVest Educational Services
- VectorVest OnLine
- VectorVest Options Analyzer
- VectorVest ProGraphics v6.0
- VectorVest ProTrader 7
- VectorVest RealTime Derby Tool
- VectorVest Simulator
- VectorVest Variator
- VectorVest Watchdog


