HOT TOPICS LIST
- Strategies
- Stocks
- Buy
- Investing
- Brokers
- Psychology
- Interviews
- Accumulate
- Sell
- Hold
- Spotlight
- Websites
- Candlestick Corner
- Gold & Metals
- Options Trading
LIST OF TOPICS
FOCUS ON
Gibson's Paradox
03/26/02 03:40:16 PM PSTby David Penn
Can an old gold-standard truism tell us anything about stocks and bonds today?
| One of the more helpful tenets of intermarket technical analysis has been the rediscovery of the leading relationship between stocks and bonds. In most market conditions, stock prices tend to follow bond prices. While there was a significant lag from time to time, this pattern held up remarkably well for most of the 20th century — so much so that it has become almost a truism among those technical analysts who include intermarket study in their observations. As John Murphy wrote in his classic Intermarket Technical Analysis,
Since bonds and stocks are historically linked together, technical analysis of one without a corresponding analysis of the other is incomplete. At the very least a stock market trader or investor should be monitoring the bond market for confirmation.
Unfortunately, there is a major assumption buried in this rediscovery. During the period of Murphy's investigation, which was for the most part during the 1980s, inflation was at a moderate level and was not forcing the bond market to respond with higher interest rates. Insofar as moderate inflation has been the norm in the US economy, there has been no overwhelming influence from inflation on the stocks-following-bonds relationship. Even in the 1970s, a period in which inflation became particularly pronounced, the relationship more or less held. With some lag, the Standard & Poor's 500 decline during the 196970 period was matched by rising yields in the 10-year Treasury (bond yields move inversely to bond prices). The rally from 1970 to 1973 in the S&P 500 was accompanied by a decline in T-note yields. The biggest cyclical bear market of the 196680 period began in 1973 and ended in late 1974, and saw yields in the 10-year Treasury rise from below 6% to nearly 8.5%. But what happens when inflation (rising prices) turns into its opposite (falling prices)? Writing in his excellent investment primer, The Hedge Fund Edge, author and hedge fund manager Mark Boucher makes the following observation about stocks, bonds, and falling prices:
Falling prices in an expanding money supply system mean that corporate margins are likely to be dropping. So in a deflation when bond prices rise and yields fall along with price levels, stock prices actually face downward pressure, instead of the normal stock-following-bond price inflationary model. Conversely, when prices begin to rebound, bond yields head up (and bond prices turn down) as the return of principal stops being a bonus. For the same reason that bond yields head up, stock prices also begin to recover, reflecting more pricing power and an end to margin pressure for corporations.
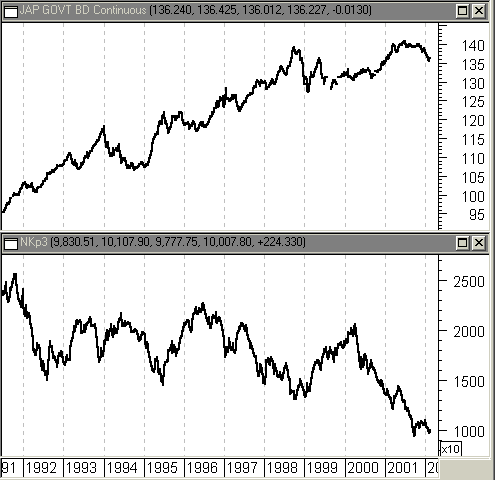
The scenario described by Boucher characterizes the Japanese economy, which began deflating at the end of the 1980s following a massive bubble in financial assets. The charts of the Japanese government bond (JGB) and the Nikkei stock index in Figure 1 support Boucher's point. Note how, in Japan's deflationary 1990s, the Nikkei stock index moved inversely to JGB prices. In other words, the Nikkei and the interest rates on the JGB were moving more or less together.
Figure 1: Japanese government bonds and the Nikkei index. In deflationary Japan, bond prices and stock prices diverge. Yields are leading stocks. This phenomenon, in which stock prices tend to follow bond yields (as opposed to bond prices), is what is referred to as Gibson's paradox. As Boucher notes, Gibson's paradox was far more common an occurrence when the United States was on the gold standard and deflation was more common. The abandonment of the gold standard in the early 1970s set the stage for a radical period of inflation, and gold-standard truisms like Gibson's paradox, which probably seemed likely to never be relevant again, were discarded. However, deflation in Japan and the specter of deflation in the US has some investors returning to Gibson's paradox in the hope of once again being able to use bonds to tell the story of stocks.
WHERE BOND PRICES COME FROMWhile the majority of the average investing public spends time paying attention to the stock market, those who are truly dedicated to studying the financial markets and their effect on the broader economy spend as much time, or more, studying bonds, especially longer-term bonds. Why is this the case? Because, to put it simply, long bonds reflect inflationary expectations — or a lack of them. Long bonds are essentially a bet on the price of money, the anticipated strength of the currency. When bond investors believe that the currency will weaken (for any number of reasons), tilting the economy toward inflation, interest rates rise. These higher interest rates are geared toward helping to offset both the declining value of the original invested principal (because the currency is weakening during an inflation period, dollars — in this case — are worth less and less) and the declining value of the interest payments themselves. Another way of putting it is that long bonds reflect the market opinion of the underlying currency. When long bond yields are higher than normal and bond prices are low, investors are reflecting fears that their cash today will be worth significantly less tomorrow. Those who lived through the 196680 inflationary secular bear market in financial assets in the US will probably remember the odd combination of financial pessimism and real asset obsession. Whether it's real estate or precious metal speculation — or even the credit-fueled consumerism ("buy now and pay later with even cheaper dollars!") that characterized the 1970s, it is almost impossible to avoid the consequences (and the occasionally odd incentives) when major inflation strikes an economy.
STANDARD GOLDWhat causes inflation? There are a variety of theories and responses, some of which are more helpful than others in the context of trading and investing. Generally, inflation reveals itself in the form of rising prices: manufactured goods, wages, retail products — you name it, its price is rising. But the cause of inflation is usually stated as "too much money chasing too few goods." The theory is more or less supply and demand, in which the price level rises in response to an "excess" amount of money in circulation. However, there is a more nuanced take on inflation. In this view, inflation occurs when the unit of account (the currency, generally speaking) becomes exceptionally undervalued. What does that mean? Currency can be valued against any number of products, goods, or services ("How many bananas can the dollar buy today?"), but most who define inflation as the debasing of the unit of account measure the currency against gold. When a currency is dropping in value against the price of gold, many observers begin to warn that inflation is creeping into the economy. There are a number of reasons gold is chosen as the object against which the value of the unit of account (currency) is measured. But one of the more compelling summaries of these reasons came many years ago from none other than Federal Reserve chair Alan Greenspan:
Gold, having both artistic and functional uses and being relatively scarce, has always been considered a luxury good. It is durable, portable, homogeneous, divisible, and, therefore, has significant advantages over other media of exchange. Since the beginning of World War I, it has been virtually the sole international standard of exchange.
Greenspan specifically was arguing in favor of the gold standard — making the dollar "as good as gold" by setting the greenback's value at a certain amount per ounce of gold (or, perhaps more practically, a range of gold prices). Nevertheless, Greenspan's comments reflect a strong belief in the value of gold — a value that is underscored by intermarket technicians such as John Murphy, who have noted the ability of gold to anticipate inflation, turns in the commodities markets, and potential changes in the long-term direction of the dollar as well.
SO NOW, DEFLATION?If inflation is characterized by a weak currency and rising prices, then deflation is characterized by a strong currency and falling prices. In a deflationary economy — such as we have seen in Japan and may be seeing in the US — the unit of account has become overvalued relative to the price of goods and services. A popularized way of saying this might be: "Too little money chasing too many goods." While falling prices must seem like a tremendous boon to consumers (which they undeniably are), a strengthening unit of account, a currency that seems as if it will always be able to buy more tomorrow than it can today, has challenging repercussions in other areas of the economy. While consumers may thrill over the constant sales, 0% financing, and multiple rebate offers, the companies that are providing this virtually free lunch are finding it more and more difficult to turn a profit. This lack of pricing power for companies means that, in addition to squeezing profit margins, companies will be reluctant to spend on expansion, capital investment, new hiring, and so on. Another group that suffers during deflation are debtors. Debtors who thrive in an inflationary environment find it increasingly difficult to retire their debts. This is because dollars are becoming increasingly expensive over the term of the debt. What might have been a reasonably sized debt with a currency valued at $1.00, for example, may become an impassable sea of red ink when the currency's value increases to $1.20 or $1.80 or more. Among the winners in a deflation, creditors and bondholders can be among the biggest. Not only is their invested principal gaining in value as the underlying currency strengthens, but their regular interest payments are coming in a strengthening currency. While these advantages come with an increased risk that the debtors will be unable to repay and might eventually default on their debts, those creditors and bondholders who remain committed to quality, investment-grade vehicles can minimize any increased default risk due to the effect of deflation on debtors.
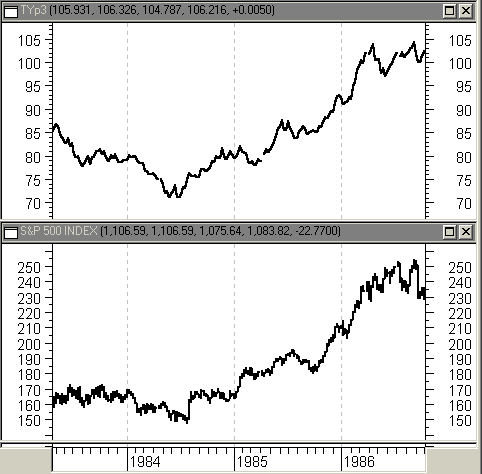
RATES RALLY, STOCKS RISE?So if bonds can be a great place to be in a deflationary environment, what about stocks? Like inflationary environments, deflation also makes major gains in the stock market more difficult to come by. However, in the same way that those watching the major market indexes during a major inflationary period such as the 1970s were able to exploit long and short (or cash) opportunities, so can investors and traders in a deflation take advantage of unique opportunities when stocks may be more likely to rise. Here is where Gibson's paradox — all but unused for decades — can once again be of assistance to those looking to trade or invest in stocks. To refresh your memory, Gibson's paradox suggests that, in a deflationary environment, stock prices will tend to follow bond yields, as opposed to bond prices. We have seen an example of this in Japan in the 1990s. Figure 2 shows the S&P 500 and the prices for the 10-year Treasury during the 1980s.
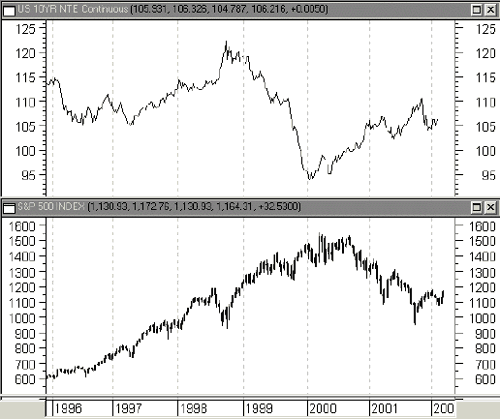
Again, note how the S&P 500 tends to follow the 10-year T-note up and down. Now consider Figure 3, a chart of the S&P 500 and the prices for the 10-year Treasury from 1996 to 2002. For most of the 1990s, the stocks-following-bonds relationship held. However, following the bond market crash in 1998 and into 1999 -- and the beginning of a bear market in stocks in 2000 -- the Federal Reserve embarked upon a virtual crusade to lower short-term interest rates (which the Fed had been raising only a year before with equal enthusiasm).
Figure 3: The stocks-following-bonds relationship. It breaks down in the late 1990s and finally gives way with the end of the bull market in 2000.
As a result, the stocks-following-bonds relationship was snapped. Ever since 2000, stock and bond prices clearly have been moving in opposite directions — just as Gibson's paradox would predict in a deflationary environment. Whether you agree, as most deflationary "true believers" do, that deflation began in the US in 1997 (the capital-gains tax cut is often cited as a catalyst, in addition to other factors), or think that it was the implosion of the stock market bubble in 2000 that heralded a new deflationary era, those who have been confounded by the refusal of stock prices to follow bond prices at least have a new tool with which to interpret the relationship between stocks and bonds. Even those who do not accept the deflation thesis can benefit from understanding some of the forces that may cause tendencies — such as the stocks-following-bonds model — to break down. The concurrence, for example, of the break in the T-note market in early March 2002 at the same time that the stock market was making its long-anticipated rally can now be seen as an expression of stocks prices following bond yields up in a show of renewed purchasing power and relatively broader corporate margins — as might occur during an inflationary respite in an otherwise deflationary environment.
David Penn may be reached at DPenn@Traders.com.
SUGGESTED READINGBoucher, Mark [1999]. The Hedge Fund Edge, John Wiley & Sons.Greider, William [1988]. Secrets Of The Temple: How The Federal Reserve Runs The Country, Simon & Schuster. Murphy, John J. [1991]. Intermarket Technical Analysis, John Wiley & Sons. Rand, Ayn [1967]. Capitalism: The Unknown Ideal, New American Library. Sperandeo, Victor [1991]. Trader Vic: Methods Of A Wall Street Master, John Wiley & Sons. Von Mises, Ludwig [1966]. Human Action, Contemporary Books. MetaStock (Equis International)
Current and past articles fromWorking Money, The Investors' Magazine, can be found at Working-Money.com.
|
Technical Writer for Technical Analysis of STOCKS & COMMODITIES magazine, Working-Money.com, and Traders.com Advantage.
| Title: | Traders.com Technical Writer |
| Company: | Technical Analysis, Inc. |
| Address: | 4757 California Avenue SW |
| Seattle, WA 98116 | |
| Phone # for sales: | 206 938 0570 |
| Fax: | 206 938 1307 |
| Website: | www.traders.com |
| E-mail address: | DPenn@traders.com |
Traders' Resource Links | |
| Charting the Stock Market: The Wyckoff Method -- Books | |
| Working-Money.com -- Online Trading Services | |
| Traders.com Advantage -- Online Trading Services | |
| Technical Analysis of Stocks & Commodities -- Publications and Newsletters | |
| Working Money, at Working-Money.com -- Publications and Newsletters | |
| Traders.com Advantage -- Publications and Newsletters | |
| Professional Traders Starter Kit -- Software | |
PRINT THIS ARTICLE

|

Request Information From Our Sponsors
- StockCharts.com, Inc.
- Candle Patterns
- Candlestick Charting Explained
- Intermarket Technical Analysis
- John Murphy on Chart Analysis
- John Murphy's Chart Pattern Recognition
- John Murphy's Market Message
- MurphyExplainsMarketAnalysis-Intermarket Analysis
- MurphyExplainsMarketAnalysis-Visual Analysis
- StockCharts.com
- Technical Analysis of the Financial Markets
- The Visual Investor
- VectorVest, Inc.
- Executive Premier Workshop
- One-Day Options Course
- OptionsPro
- Retirement Income Workshop
- Sure-Fire Trading Systems (VectorVest, Inc.)
- Trading as a Business Workshop
- VectorVest 7 EOD
- VectorVest 7 RealTime/IntraDay
- VectorVest AutoTester
- VectorVest Educational Services
- VectorVest OnLine
- VectorVest Options Analyzer
- VectorVest ProGraphics v6.0
- VectorVest ProTrader 7
- VectorVest RealTime Derby Tool
- VectorVest Simulator
- VectorVest Variator
- VectorVest Watchdog


