HOT TOPICS LIST
- Strategies
- Stocks
- Buy
- Investing
- Brokers
- Psychology
- Interviews
- Accumulate
- Sell
- Hold
- Spotlight
- Websites
- Candlestick Corner
- Gold & Metals
- Options Trading
LIST OF TOPICS
THE CHARTIST
Moving Averages
04/02/02 01:51:41 PM PSTby Dennis D. Peterson
Understanding the basics can help you trade moving averages much more efficiently.
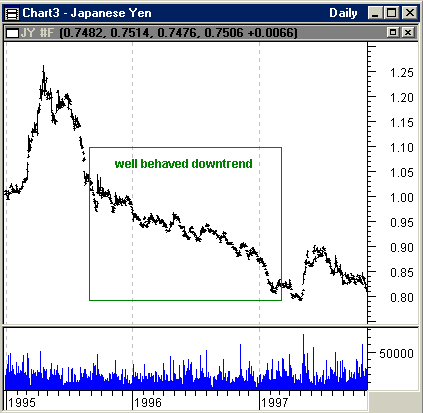
| Moving averages — so simple, yet they can lead to disaster if they are used incorrectly. The secret is in the selection of the time period. Selecting a time period after back-testing for the past 20 years of data, for example, may not give you the answer you seek. Moving averages are trend-following devices, and when you use them you need to be sure you are in a trend. Some commodities trend better than equities; for example, look at the trend of yen in Figure 1.
Figure 1: Daily yen. Moving averages are best used during lengthy trends. Currencies such as the yen can show prolonged, well-behaved trends, such as those within the green box, where prices change at the same rate. For a year and a half, the yen was in a downtrend, and if you start looking earlier, at 1995, the overall trend is even longer. There aren't many equity charts with a prolonged, well-behaved downtrend — something that declines at the same rate for more than six months. The keyword here is rate. If the rate of change is jumping around, then moving averages have to catch up. For example, when someone tells me he uses a moving average period that has worked well for the last 20 years, I have to wonder what would make him think that today's rate can be compared to yesterday's, or for that matter, the last 20 years. And what would make him think that prices go up as fast as they go down?
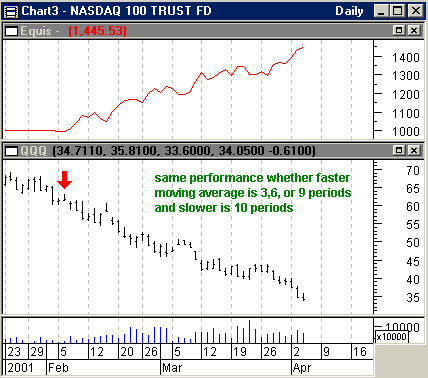
THE NUMBER OF PERIODSI'll show you a couple of charts that illustrate this point. Take a look at the daily chart of the QQQ in Figure 2. I selected a time period when prices were in a clear downswing and, using the MetaStock System Tester, optimized on the periods for the moving average crossover of two exponential moving averages. The strategy is to enter short when the faster moving average is less than the slower one, and enter long when the faster average is greater than the slower one. The faster moving average is the one with fewer number of periods, and the slower moving average is the one with the greater number of periods.
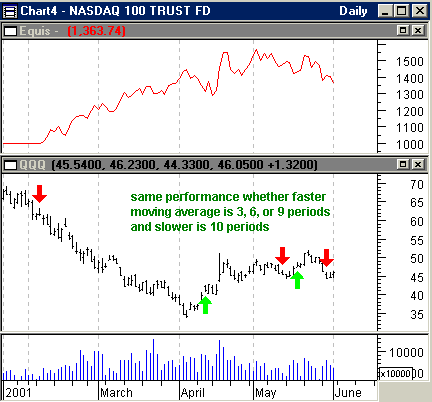
Figure 2: Performance of a moving average crossover system. Taking a short position when the faster moving average is below the slower one, and a long position when the faster moving average is greater than the slower one, results in $1,000 of equity growing to $1,400 or more in just two months. The equity performance is the same for any one of the three periods. The system found that the best equity performance was a faster moving average of three, six, or nine periods with a slower moving average of 10 periods. Suppose you looked at a slightly longer time frame. What you see in Figure 3 is a system that still suggests the best performance comes from using the same moving average periods as in Figure 2. This is because the short-side gain from the beginning of 2001 to April 2001 dominates.
Figure 3: Expanding the time period. The same exponential moving average crossover system was used as in Figure 2. The same periods are selected, because the short position opened at the beginning of the year dominates the equity performance.
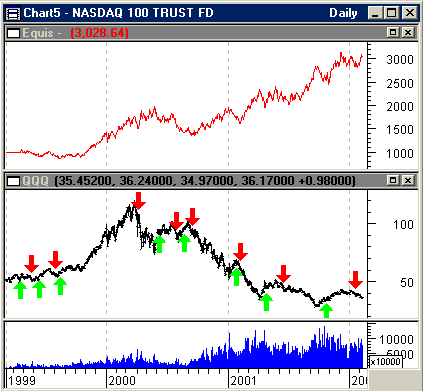
Now, suppose you looked at an even longer time frame (Figure 4).
Figure 4: Equity performance over a period of three years. Equity performance here is better than that in Figures 2 and 3, and the periods chosen after optimization differ greatly from those selected for Figures 2 and 3. An exponential moving average crossover system was used, but unless you know the time periods beforehand, your chances of getting this kind of performance are slim.
What do you think are the periods (fast and slow) of the moving averages and equity performance for this choice of time frame? The answers: 12 and 30 for an equity gain of $2,028.64 (Figure 4), 3 and 70 for an equity gain of $1,921.48, and 15 and 20 for an equity gain of $1,383.33. So the gains fall off fast from the best equity performance, and the number of periods is all over the map. This doesn't make for a stable system. If you try 12 and 30 moving average periods on the daily chart of the QQQ from mid-January 2001 to May 2001, you will just get one trade instead of the five shown in Figure 3 (where three, six, and nine periods are used). But these periods optimized for shorter time frames give you $400 of equity gains in four and a half months versus $2,028 in 38 months using the longer moving averages from the longer time frame (Figure 4). However, if you selected 15 and 20 periods — the third best profit for the longer time frame — you would only make $383 in 38 months. Periods developed over longer time spans can result in extremely poor profit performance in the short term.
UNDERLYING ASSUMPTIONSWhen you use moving averages, in order to make a profit you are depending on a given trend to continue. This requirement could work for some markets like the yen, but not for others like pork bellies and most equities (both of which are well-known for experiencing lots of ups and downs). You need to exercise caution when picking your market. When using moving averages, you are relying on their lag — a lag that makes the current price higher than the average one, if you are in an uptrend. Your strategy is to buy when prices are higher than the moving average. If prices stay in the uptrend, you make a profit. You also need to select the number of periods to use in your moving average. Finally, a moving average crossover system like the one I used previously will do better than a system that uses just one average, going long when prices are above the moving average, and going short when prices are below it.
SIMPLE VS. EXPONENTIAL
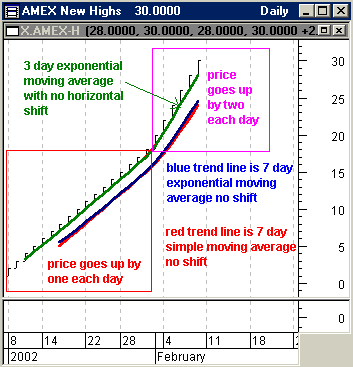
Have you ever wondered how different a simple moving average and an exponential moving average look when they're applied to a perfect uptrend? They are actually fairly similar. For a number of days, I entered prices that increased by one (Figure 5: prices enclosed by red box) and then switched to increasing them by two (Figure 5: prices enclosed by the purple box) for the remainder of the chart. Are you surprised to see that both the seven-day simple and exponential moving averages (EMA) are nearly identical? The seven-day exponential moving average (EMA) weights each new day by 25% and adds that to the previous value of the EMA. The formula to convert from days to percentage is 2/(n+1), where n = the number of periods, which in this case is 2/(7+1)=2/8=25%. As a side note, the way you prime the pump for EMAs is to start with the first day's close, assuming you are averaging closes (there are usually better choices, but we'll get into that later), and set that equal to EMA. Day 2 is the previous EMA, which is yesterday's close multiplied by 75% (1 - 25%), plus 25% of the close of day 2. Continue on in the same fashion with each subsequent day. The formula in general is (Today's close) * ("n" percentage) + (Yesterday's average) * (1- "n" percentage), where n is the number of periods you put in 2/(n+1) to get a percentage.
Figure 5: Perfect uptrend created by manually entering OHLC values. There is little or no difference between the seven-day simple moving and exponential moving averages when you have a stable uptrend or downtrend. If you horizontally shift a moving average by half the number of periods, the simple moving average of seven days will line up with the green three-day exponential average. Not shifting results in the averages lagging and thus leads to the trading rule: go long if price crosses above and short if prices go below. This rule only works if you are looking at a stable trend.
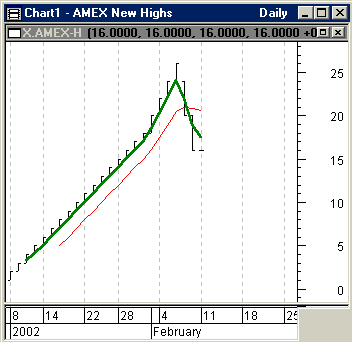
If you horizontally shift the simple moving average by half the periods, you will end up overlaying the three-day exponential moving average. Of course, your moving average line is going to terminate three bars before the present. But my point here is to reinforce the idea that moving averages are trend-following devices. Whether they make for a good trading system, however, is another question. Suppose prices suddenly turn. To show what happens, I manually entered decreases of $4 per day after reaching $26. Increases started at $1 a day, went to $2 a day, and then reversed, going down at the rate of $4 a day. Prices going down faster than they did going up after rate increases is typical market behavior. The major difference between this scenario and what actually happens in the market is that the market often decides to consolidate after seeing a change in positive or negative rate. Since moving averages are trend-following devices, if the trend changes direction, a moving average will quickly move to the new trend. If I had made the last day in Figure 6 a third-day reversal instead of one that has O=H=L=C (that is, a very narrow-range day), you would be whipsawed by the simple moving average; you would be changing from long to short and back again to long, and losing money on the changes. But even with less dramatic changes, you can get whipsawed on the exponential as well.
Figure 6: Perfect uptrend created by manually entering OHLC values. Prices take a sudden downturn after reaching $26. The three-day exponential moving average (green line) immediately responds, and the seven-day simple moving average lags. The weighting of the three-day exponential moving average is 2/(3+1)=50%, which puts a lot of weight on the current close. When you use a 20-, 50-, and 200-day combination of moving averages to monitor price activity, you are making an assumption about underlying behavior concerning price rate change. Those averages often work, but only because others are using them too. They work by chance.
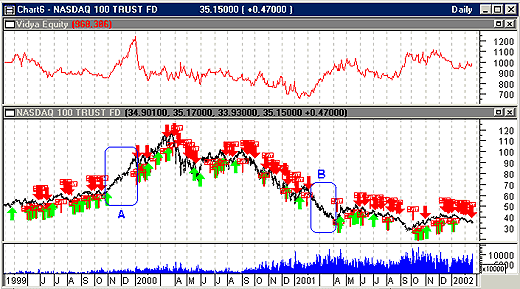
VARIABLE MOVING AVERAGESThere are alternatives to using moving averages. One approach you might try is to automatically adjust the number of periods based on price volatility. This approach, called Vidya, was developed by Tushar Chande. Chande uses his CMO (Chande momentum oscillator) to measure price volatility, while I prefer to use the standard deviation of price. A common trading approach is to build a channel envelope 1% above and below the automatically adjusting moving average and to go long if the close is above the channel or to go short if the close is below the channel. Using Vidya but letting the system optimize on all the variables, including the width of the envelope, results in a trading performance for daily QQQ that is worse than the moving average crossover system shown in Figure 4 — a trading system that enters long if today's close is above the upper channel and enters short if today's close is below the bottom channel. However, Vidya has the potential to be the basis of a high-performing trading system if you are looking to trade trends, which you can see by observing where the $1,000 equity moved up sharply. The biggest gains in equity come in time periods where price moved into a trend (Figure 7: areas A and B). In the commodities market you can build on your position by leveraging a portion of your profits and make a significant amount of money in a hurry. With good money management, you can develop highly profitable, moving average-based trading systems to use for commodities. All you need is the right market, fairly deep pockets while your capital is nibbled away with sideways-moving markets, and a decent money management plan, and you should do well each year.
Figure 7: Optimizing Vidya variables. The best equity performance occurs in areas A and B. But this performance is not as good as a more general moving average crossover system, when you are not paying attention to whether a trend has started. IS MACD THE ANSWER?Using Vidya allows you to lock in on a trend fairly quickly, but a more robust indicator is the moving average convergence/divergence (MACD), which measures the momentum of price change by taking the difference of two moving averages, and comparing that difference to the moving average of the difference. If this confuses you, just remember the MACD is built around a two-step process: (1) create the difference of two moving averages and call it Diff; (2) take the moving average of Diff and call it Signal. When Diff is greater than Signal, go long, and if Diff is less than Signal, go short. Introducing price momentum adds information that you'll rely on when you're trading with moving averages. Prices in a trend tend to stay in that trend because of momentum. When you look at market behavior to understand why MACD sometimes fails, you'll begin to realize the market's efforts to normalize itself relative to the number of up versus down days provides a large number of two- and three-day sequences of successive up and down days that are countertrend or counterswing. To remove this noise, rather than use the close of each day you can use a triangular scheme of close:
(close + 2*yesterday's close + 2* day before yesterday's close + close three days ago)/6.
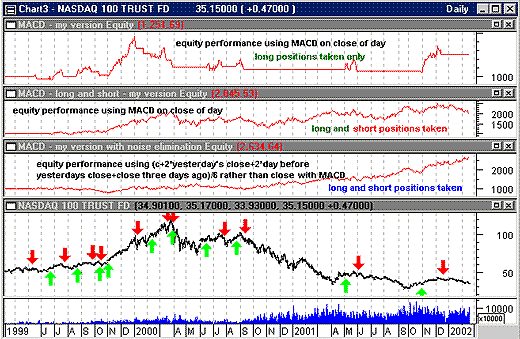
If you compare three different MACD-based trading systems, optimizing on 1,000 combinations of Diff moving average periods and Signal moving average periods, the conclusion you may draw is that it's best to use the triangular scheme of closes. If you trade for long positions only, requiring Diff>0, you get the worst result in terms of total equity gain. Each system goes long when Diff>Signal, or short when Diff<Signal. The variations are to use a triangular set of closes, go long and short using closes, or go long only, using closes (see Figure 8).
Figure 8:
SUMMARYTo maximize profit with moving averages, you want a system that follows trends and trend changes closely and yet prevents you from being taken out of your position by the noise of two- and three-day countermoves. Since moving averages are trend-following devices, most of your profits are made when prices are trending. For example, you might make as much profit from four and a half months of simply trading a trend as you would make by staying in the market for 38 months, continually trying to make moving averages produce profitable trades. You should also build on your position with a portion of your profits as the trend unfolds. If you wait too long, the market can eat into your account until you begin to believe it's only there to go sideways and nibble away at your money. In addition, be aware some commodities do a better job of trending than stocks. So when you pick your trading system and understand what it is designed for, determine the market that best fits it. Most important, employ a money management system, even if it is only to have protective stops.
Dennis Peterson may be reached at DPeterson@Traders.com.
RELATED READINGChande, Tushar S. [1992]. "Adapting Moving Averages To Market Volatility,"Technical Analysis of STOCKS & COMMODITIES, Volume 10: March._____, and Stanley Kroll [1994]. The New Technical Trader, John Wiley & Sons. MetaStock (Equis International)
Current and past articles from Working Money, The Investors' Magazine, can be found at Working-Money.com.
|
Market index trading on a daily basis.
| Title: | Staff Writer |
| Company: | Technical Analysis, Inc. |
| Address: | 4757 California Ave SW |
| Seattle, WA 98116-4499 | |
| Phone # for sales: | 206 938 0570 |
| Fax: | 206 938 1307 |
| Website: | working-money.com |
| E-mail address: | dpeterson@traders.com |
Traders' Resource Links | |
| Charting the Stock Market: The Wyckoff Method -- Books | |
| Working-Money.com -- Online Trading Services | |
| Traders.com Advantage -- Online Trading Services | |
| Technical Analysis of Stocks & Commodities -- Publications and Newsletters | |
| Working Money, at Working-Money.com -- Publications and Newsletters | |
| Traders.com Advantage -- Publications and Newsletters | |
| Professional Traders Starter Kit -- Software | |
PRINT THIS ARTICLE

Request Information From Our Sponsors
- StockCharts.com, Inc.
- Candle Patterns
- Candlestick Charting Explained
- Intermarket Technical Analysis
- John Murphy on Chart Analysis
- John Murphy's Chart Pattern Recognition
- John Murphy's Market Message
- MurphyExplainsMarketAnalysis-Intermarket Analysis
- MurphyExplainsMarketAnalysis-Visual Analysis
- StockCharts.com
- Technical Analysis of the Financial Markets
- The Visual Investor
- VectorVest, Inc.
- Executive Premier Workshop
- One-Day Options Course
- OptionsPro
- Retirement Income Workshop
- Sure-Fire Trading Systems (VectorVest, Inc.)
- Trading as a Business Workshop
- VectorVest 7 EOD
- VectorVest 7 RealTime/IntraDay
- VectorVest AutoTester
- VectorVest Educational Services
- VectorVest OnLine
- VectorVest Options Analyzer
- VectorVest ProGraphics v6.0
- VectorVest ProTrader 7
- VectorVest RealTime Derby Tool
- VectorVest Simulator
- VectorVest Variator
- VectorVest Watchdog

