HOT TOPICS LIST
- Strategies
- Stocks
- Buy
- Investing
- Brokers
- Psychology
- Interviews
- Accumulate
- Sell
- Hold
- Spotlight
- Websites
- Candlestick Corner
- Gold & Metals
- Options Trading
LIST OF TOPICS
MARKET UPDATE
That '70s Show
04/09/02 04:10:04 PM PSTby David Penn
Do a little dance, make a little love. . . inflation is back in vogue.
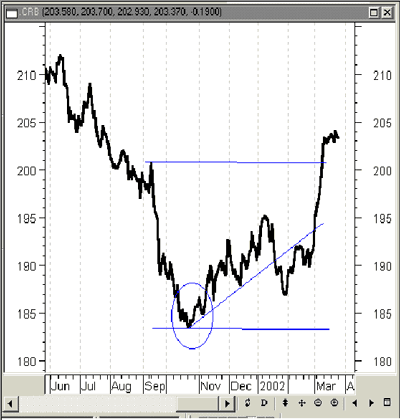
| These must be confounding times for those who have spent the past five years alerting the investing public to the dangers of deflation. Deflation — the process through which a currency becomes overvalued relative to goods and services available, resulting in a decline in pricing power — was the last phase of the disinflation wave that began in the early 1980s as the chronic inflation of the 1970s was finally eliminated from the US economy. Most evident in the bearish commodities markets, deflation and its discontents (increased burdens for debtors, for example) subsequently dragged down both the telecommunications and technology sectors as companies were caught between the economic "rock and a hard place" of declining prices and increasing productivity. Yet save for the occasional reference by perceptive observers such as Jude Wanniski (Supply Side Investor), Bruce Bartlett (National Center for Policy Analysis), Don Luskin (TrendMacrolytics), and David Malpass (Bear Stearns), the deflation that has been worming its way through the world economy (Japan began deflating in 1990) has been either ridiculed or ignored by most of the in-the-know financial crowd from Bloomberg to BusinessWeek. So what are we to make of the suggestion now that many observers makes that a little inflation might be just what this nascent world economic recovery needs? BusinessWeek reported in March that the prince of price stability, Federal Reserve Board chairman Alan Greenspan, "signaled" a willingness to let inflation drift upward if such a drift would help restore pricing power (and profit margins) to corporations. Even though Greenspan quickly asserted he believed any rise in inflation would be relatively short-lived — due both to the Fed's "New Economy" productivity thesis and Greenspan's own determination to keep inflation at bay — his remarks were an indication there would be no hurry to raise short-term interest rates at the first signs of dollar-destroying inflation. Why the new tolerance? Well, forgetting for a moment those voices that have been suggesting of late that there might not have ever really been a recession at all (see Bloomberg to BusinessWeek above), and the fact that inflation has been the Federal Reserve Board's version of the Great White Whale for most of the past 10 years, we are left with an almost inescapable economic fact. When companies are saddled with debt and have no reason to borrow more, and when people are saddled with debt and have no reason to borrow more, and when the government itself decides that, in a manner of speaking, deficits are people too, the only way to grow the economy is, in the immortal words of Lauren Bacall, to "put your lips together and blow." Evidence of a reinflating world economy is most apparent in the commodities market. Both gold's recent advance and the collapse of the long bond this spring confirm the move upward in a variety of commodities. The CRB index (Figure 1) is up 6% year-to-date (closer to 11% from its October 2001 bottom), as is the June gold futures contract. The Philadelphia Gold/Silver Index is up almost 25% in 2002. June crude is up 24% for the year to date and June copper is up 12%. Weakness in agricultural commodities remains — although at least soybeans appear to have formed a significant base and are up almost 9% year-to-date.
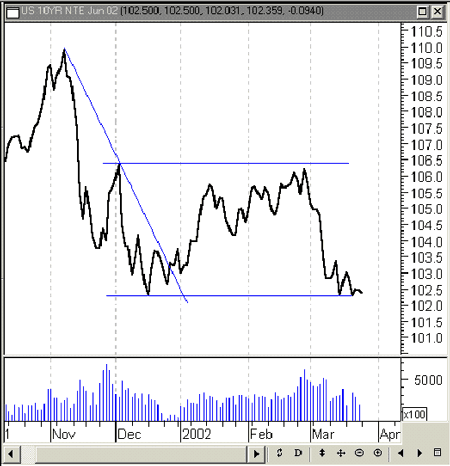
Figure 1: CRB Index. Rising commodities prices suggest a reflation of the economy is under way. In addition, President George W. Bush's decision to award domestic steel the lion's share of its tariff demands, and a similarly protectionist decision against Canadian lumber, are likely to send inflationary ripples throughout the manufacturing industry — to say nothing of encouraging other nations to set up their own inflationary trade protections (Russians are holding back on US poultry, while the European Union is holding back on US tomatoes, among other goods). The reaction by the long bond market has been evidence enough that inflation has been allowed back in (Figure 2). The sharp selloff in the 10-year Treasury has been blamed on a number of things: among them, a move of capital into the stock market (which has resumed its intermediate bull market) and a move of capital into corporate bonds. There is value in both arguments. The Dow 30, which entered a line at the end of 2001 following a significantly bullish countertrend rally, has been moving to the upside again. And the GE debt offering this spring was a record for corporate bond issuance (even as PIMCO's bond guru Bill Gross warns that GE is getting overextended in terms of its debt).
Figure 2: 10-year Treasury note. The selloff in the Treasury note comes as a warning that inflation risks are growing.
But neither of these arguments refute (or even address, necessarily) the ability of the long bond to anticipate inflation. It is only a mild stretch to suggest that long bonds exist to anticipate inflation, with the truth simply being that investors demand higher interest rates when there are fears that the principal they have lent will lose value over the duration of the loan. The sharpness of the upward move in commodities is just as sharp as the downward move in the 10-year Treasury. It is certainly possible that these are merely intermediate spasms, and not the beginnings of new primary moves. Nevertheless, the trends are in place. And until trends prove otherwise, the advantage is on the side of those who follow them.
THE EASING SEASONFifteen months after the easing began and stock averages are lower than before. Even before the Federal Reserve Board began its historic campaign to lower short-term interest rates in the wake of the dotcom bust and the collapsing stock market, Fed veterans were warni ng that interest rate cuts would bring relief "eventually" rather than "immediately." How eventually is "eventually"? Conventional wisdom seemed to suggest that anywhere from four to six to nine months after the Fed began cutting interest rates, the results would start to appear in the economy (read: the stock market). Where does this four- to six- to nine-month period come from? For better and worse, historical precedent suggests that the healing touch of Fed funds cuts has worked wonders during both secular bear and secular bull markets. And with investors now looking for the Federal Reserve Board to begin raising short-term rates within the next few months, it seems worthwhile to look at just what the markets have gotten for their 11 rate cuts — as well as what past interest rate-cutting campaigns have done for equities.
Generally speaking, stocks have responded well in the past as short-term rates have been reduced in a quick, dedicated fashion. Unfortunately, buy and holders responding to this "don't fight the Fed" axiom stumbled upon a rude exception in the 21st century:
Those who began buying on the notion that, as the Federal Reserve Board began adding liquidity to the economy, stocks would rise shortly thereafter were burned this time around, with the Dow Jones Industrial Average (DJIA) in the red for all of 2001. For the Standard & Poor's 500 and Nasdaq, the news was worse: the S&P 500 declined by 11% during the "easing season" and the Nasdaq fell more than 19%. None of this is meant to suggest that the Federal Reserve Board was wrong to lower short-term interest rates (what would the DJIA have returned had short rates remained at 5%?). But the lack of strength in equities during this period does cast a dark light on the prospects for equities after the easing season is done. In much the same way many have suggested that because housing and consumer spending held firm during the recession, they cannot be expected to play a major role in the recovery, so it seems that equity weakness during the easing season portends more equity weakness — not less — when the season comes to a close, as by all accounts it has. There are, of course, some caveats to this bearish outlook for equities. First, as I mentioned in an article last month, there is the possibility that rising short-term rates (when short-term rates begin to advance) may act as a spur to stock prices. Such a scenario would assume that deflation — an overvaluing of the currency — was still in place and that rising short-term yields were helping to restore pricing power to corporations (in a deflation, stock prices correlate with bond yields, as opposed to bond prices). This can be especially so when increases in short-term yields are accompanied by declines in long-term yields. The second caveat has to do with inflation. Commodity producers often do well under an environment of rising inflation when commodities prices are under upward pressure. This advantage for commodity producers also extends to countries — many of which are emerging markets — whose economies are largely commodities-based. Should the global economy continue to reflate, these emerging markets and commodity-based markets could actually see significant gains, instead of the relentless losses that have characterized emerging-market investments for years.
David Penn may be reached at DPenn@Traders.com.
SUGGESTED READINGPenn, David [2002]. "Gibson's Paradox," Working-Money.com, March 26.MetaStock (Equis International)
Current and past articles from Working Money, The Investors' Magazine, can be found at Working-Money.com.
|
Technical Writer for Technical Analysis of STOCKS & COMMODITIES magazine, Working-Money.com, and Traders.com Advantage.
| Title: | Traders.com Technical Writer |
| Company: | Technical Analysis, Inc. |
| Address: | 4757 California Avenue SW |
| Seattle, WA 98116 | |
| Phone # for sales: | 206 938 0570 |
| Fax: | 206 938 1307 |
| Website: | www.traders.com |
| E-mail address: | DPenn@traders.com |
Traders' Resource Links | |
| Charting the Stock Market: The Wyckoff Method -- Books | |
| Working-Money.com -- Online Trading Services | |
| Traders.com Advantage -- Online Trading Services | |
| Technical Analysis of Stocks & Commodities -- Publications and Newsletters | |
| Working Money, at Working-Money.com -- Publications and Newsletters | |
| Traders.com Advantage -- Publications and Newsletters | |
| Professional Traders Starter Kit -- Software | |
PRINT THIS ARTICLE

Request Information From Our Sponsors
- StockCharts.com, Inc.
- Candle Patterns
- Candlestick Charting Explained
- Intermarket Technical Analysis
- John Murphy on Chart Analysis
- John Murphy's Chart Pattern Recognition
- John Murphy's Market Message
- MurphyExplainsMarketAnalysis-Intermarket Analysis
- MurphyExplainsMarketAnalysis-Visual Analysis
- StockCharts.com
- Technical Analysis of the Financial Markets
- The Visual Investor
- VectorVest, Inc.
- Executive Premier Workshop
- One-Day Options Course
- OptionsPro
- Retirement Income Workshop
- Sure-Fire Trading Systems (VectorVest, Inc.)
- Trading as a Business Workshop
- VectorVest 7 EOD
- VectorVest 7 RealTime/IntraDay
- VectorVest AutoTester
- VectorVest Educational Services
- VectorVest OnLine
- VectorVest Options Analyzer
- VectorVest ProGraphics v6.0
- VectorVest ProTrader 7
- VectorVest RealTime Derby Tool
- VectorVest Simulator
- VectorVest Variator
- VectorVest Watchdog


