

HOT TOPICS LIST
- Strategies
- Stocks
- Buy
- Investing
- Brokers
- Psychology
- Interviews
- Accumulate
- Sell
- Hold
- Spotlight
- Websites
- Candlestick Corner
- Gold & Metals
- Options Trading
LIST OF TOPICS
ARE YOU KIDDING
The Kilroy Bottom
04/16/02 03:37:06 PM PSTby W. H. C. Bassetti
Here's a solution to a serious taxonomic problem. Or maybe not. In any case. . .
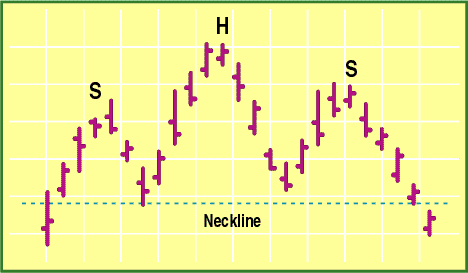
| Fundamental analysts, although generally clueless, will be pleased to learn that the discipline of technical analysis has a rich taxonomic vocabulary. For the benefit of those who missed out on studying ancient Greek, let me point out that taxonomic does not refer to the IRS in any way or to getting around New York City. It refers instead to the system of naming and classifying elements of a discipline or environment, for example, the classification of plants according to their nature and relationships. Technical analysts talk of areas of support and resistance, of rectangles and triangles, of bulls and bears, of dogs and dead cats (bounces) and blue chips. So if the average analyst (or even the below-average analyst) thinks about it for a moment, he will quickly realize that the discipline has an exceedingly rich taxonomy. And the individual elements of this vocabulary aid us in conceptualizing and analyzing events in the market. For example, we recognize a rectangle as a consolidation of or reversal of a trend. At the end of a bull market we see and recognize top formations of various shapes double and triple tops, v tops, and most popular among the general population, head-and-shoulder tops. This head-and-shoulder top (see Figure 1) forms at the end of a bull run as prices flow to a peak (left shoulder) and subside, then assault and exceed the first top to form the head, only to fall back near the previous low (the neckline). Finally, propelled by heedless bargain hunters, price makes another assault but only reaches more or less the level of the first peak, forming the right shoulder. The formation is confirmed as a head-and-shoulders top when prices fall definitively through the neckline.
Figure 1: A simple head-and-shoulders top.
Standing this pattern on its head, we see the sadly misnamed head-and-shoulders bottom. Only if we visualize the market upside down does this inept taxonomy make sense. (Otherwise, we might say it taxes the imagination, but I digress.) Since my earliest days as a student and client of John Magee and reader of his and Robert Edwards' magisterial work Technical Analysis Of Stock Trends, I have been tormented by the inadequate classification of this kind of bottom. Recently, while revising that same work for its eighth edition, I was struck by a brilliant inspiration not unlike that of Samuel Taylor Coleridge as he composed "Xanadu" (though no opium was involved in my case). I realized on reexamining the pattern that it bore a resemblance to some image I remembered having seen in my childhood. For weeks I was tortured both in dreams and daylight, trying to retrieve that memory from my deepest subconscious. In despair, I considered calling it a WHCBottom and trademarking it. Then one day it came to me, as if I had seen the writing on the fence. The pattern looks like the irreverent World War II graffito that traveled the world with American troops. The so-called head-and-shoulders bottom actually resembles Kilroy!
Figure 2: The Kilroy bottom.
What was the left shoulder now becomes the left hand, the head becomes the nose, and the right shoulder becomes the right hand. The neckline continues to be the neckline — or perhaps I should refer to it as the fenceline. (In fact, break of the fenceline has a nice ring.) These formations are usually rather complex (rarely do they appear in their perfect form), but with this taxonomic alternative, what would have been many little upside-down shoulders now are aptly described as fingers on Kilroy's hands. This piece of American ingenuity perfectly describes many forms of bottom that occur at the end of bear markets. It certainly describes trading activity better than the discredited term "head-and-shoulders bottom." I am extremely pleased to have discovered this advance in taxonomic resources, and rather than trademarking it, I am contributing it to the public domain for the benefit of science and technology, for what it's worth. Analysts are free to use it or not. (My graduate students will be flunked if they don't.)
W.H.C. Bassetti is a recovering trader, sometime CTA, and adjunct professor of finance and economics at Golden Gate University in San Francisco. He is also the editor and coauthor of the 8th edition of Edwards and Magee's classic, Technical Analysis Of Stock Trends. He writes a weekly Internet letter at www.johnmageeta.com.
SUGGESTED READINGEdwards, Robert D., and John Magee [2001]. Technical Analysis Of Stock Trends, 8th ed., W.H.C. Bassetti, ed. Saint Lucie Press.
Current and past articles from Working Money, The Investors' Magazine, can be found at Working-Money.com.
|

PRINT THIS ARTICLE

Request Information From Our Sponsors
- StockCharts.com, Inc.
- Candle Patterns
- Candlestick Charting Explained
- Intermarket Technical Analysis
- John Murphy on Chart Analysis
- John Murphy's Chart Pattern Recognition
- John Murphy's Market Message
- MurphyExplainsMarketAnalysis-Intermarket Analysis
- MurphyExplainsMarketAnalysis-Visual Analysis
- StockCharts.com
- Technical Analysis of the Financial Markets
- The Visual Investor
- VectorVest, Inc.
- Executive Premier Workshop
- One-Day Options Course
- OptionsPro
- Retirement Income Workshop
- Sure-Fire Trading Systems (VectorVest, Inc.)
- Trading as a Business Workshop
- VectorVest 7 EOD
- VectorVest 7 RealTime/IntraDay
- VectorVest AutoTester
- VectorVest Educational Services
- VectorVest OnLine
- VectorVest Options Analyzer
- VectorVest ProGraphics v6.0
- VectorVest ProTrader 7
- VectorVest RealTime Derby Tool
- VectorVest Simulator
- VectorVest Variator
- VectorVest Watchdog