HOT TOPICS LIST
- Strategies
- Stocks
- Buy
- Investing
- Brokers
- Psychology
- Interviews
- Accumulate
- Sell
- Hold
- Spotlight
- Websites
- Candlestick Corner
- Gold & Metals
- Options Trading
LIST OF TOPICS
FOCUS ON
Volatility
04/23/02 03:56:04 PM PSTby David Penn
Variation from the mean is the name of the game.
| Peter Tanous: I suppose that makes your style more volatile than most money managers.
Richard Driehaus: Yes, we do have volatility, but in general our volatility is on the upside. We're more up than down. And when we're up, we're up in greater measure than when we're down. It is important to understand that upside volatility is not a negative. It works to our advantage.
The suggestion by Richard Driehaus (of Driehaus Capital Management) that upside volatility "is not a negative" is common knowledge to most experienced investors and traders. Since volatility simply refers to the tendency (or lack thereof) toward variation and difference, it can be confidently said that without volatility, investing or trading in the markets would be almost pointless. A stock purchased at $30 that suffers no volatility at all will likely be sold at or about $30, not including the commission costs of the trade. While there are options strategies that take advantage of an absence of volatility (such as selling straddles and strangles), for most investors and traders, upside volatility is a good thing. For traders who go short as willingly as they go long, any kind of volatility is good volatility. There is a variety of popular measures of volatility, from Bollinger Bands to the market volatility index, known simply as VIX. This discussion of volatility will look at two popular volatility indicators, standard deviation and average true range (ATR), before introducing a volatility-oriented trading strategy using historical volatility, which will help traders and investors find securities before they are ready to make major moves.
DEVIATION TOPS AND BOTTOMSThe basic statistical measure of volatility is standard deviation. While there is not nearly enough room in this article to completely cover statistical methods, understanding what standard deviation is and how it is used by investors and traders looking to time their purchases is helpful for everyone involved in the markets. At its most fundamental, standard deviation is the measure of variance from the mean or arithmetic average. Another way of referring to it is that standard deviation takes into account how far from normal that outlying data may be — "normal" being another word for the mean or average. Low standard deviations mean data does not stray much from the set's mean. Conversely, datasets with high standard deviations include data that varies in value from the arithmetic average of the overall dataset. As Peter Bernstein puts it in his bestseller, Against the Gods: "This measure . . . is critically important in judging whether a set of observations comprises a sufficiently representative sample of the universe of which they are just a part. . . . The standard deviation can tell us whether we are dealing with a case of head-in-the-oven, feet-in-the-refrigerator, where the average condition of this poor man is meaningless in telling us how he feels." The implications of standard deviation for securities investors and traders should become increasingly clear. On a simple risk basis, securities with higher standard deviations are more likely to see dramatic changes in price than are securities with lower standard deviations. At the same time, securities with higher or rising standard deviations tend to have a greater profit potential (long or short) than securities with lower or falling standard deviations. Some, as Steven Achelis mentions in his Technical Analysis From A To Z, consider higher standard deviation values to also be suggestive of market tops, while lower standard deviation values are considered suggestive of market bottoms. We will see how well this adage holds up in some of the examples that follow.
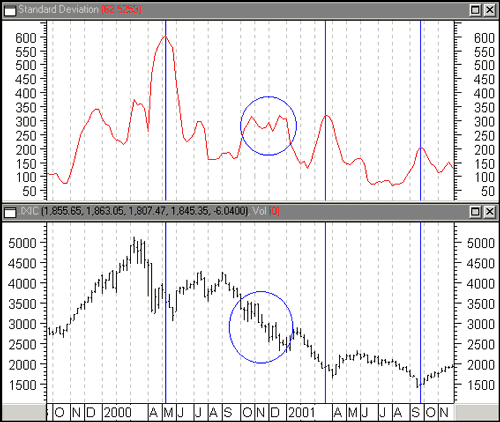
Figure 1: Standard deviation and the Nasdaq. There is a clear lack of correlation between high standard deviation and market tops.
Our first look at standard deviation and price action in the Nasdaq bear market in Figure 1 suggests that some of the received wisdom on standard deviation may be inaccurate. Note that it was suggested that higher standard deviation values tend to indicate market tops. In the case of the Nasdaq, we note mostly three spikes in standard deviation, suggesting that prices are finding themselves farther from the historical average. However, these spikes in — May 2000, March 2001, and September 2001 — developed simultaneously with significant lows, not tops, in the Nasdaq. Troughs in the standard deviation indicator — most notably in June 1999 and June 2001 — here seem to correspond more with temporary market tops in the Nasdaq, as opposed to market bottoms.
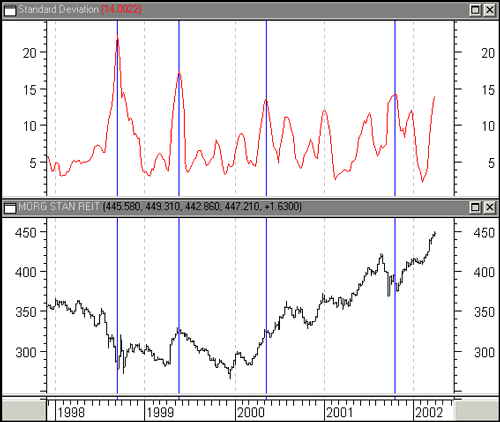
Figure 2: Standard deviation and the REITs. Spikes in standard deviation arise with both peaks and troughs.
Looking at the Morgan Stanley REIT index (see Figure 2), which has been in a bull market since October 2000, we see spikes in standard deviation corresponding with both market bottoms (September 1998), temporary market tops (May 1999), and even trends in progress (May 2000). Thus, the connection between higher standard deviation values and market tops seems to be a bit suspect. This helps to underscore that standard deviation — much like average true range, which will be discussed next — is most often used as a component in building indicators, as opposed to being an indicator in and of itself. Perhaps the quintessential example of using standard deviation in an indicator would be Bollinger Bands, which are produced by adding and subtracting the standard deviation value from a 20-day moving average of prices. The result is an indicator that resembles a band around prices. This band becomes narrower when volatility decreases and expands around prices when volatility increases.
HOME ON THE AVERAGE TRUE RANGEA volatility indicator that is somewhat similar to standard deviation in application is the average true range (ATR). Developed by J. Welles Wilder, average true range may be more common as a component in other indicators and trading strategies than as a stand-alone indicator. Here, I will present the average true range largely on its own, with a few notes later about how ATR is used in combination with other technical tools by investors and traders. The average true range (ATR), according to STOCKS & COMMODITIES contributor Gordon Gustafson, is a superior measure of volatility for trading purposes, compared to standard deviation. The ATR itself is built by taking three of Wilder's "true ranges." The true range is the largest of the distance from today's high to today's low, the distance from yesterday's close to today's high, or the distance from yesterday's close to today's low. The average true range, then, is a moving average of the true ranges over a period of time — a 14-day period is often used, and is a common default in many charting software packages and websites.
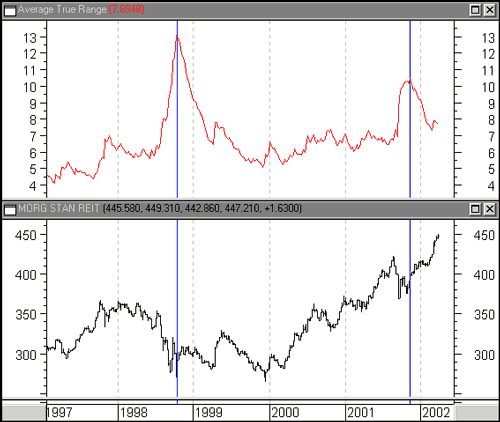
Figure 3: Average true range and the REITs. ATR does a better job of providing volatility signals than does standard deviation.
Applying the average true range to the Morgan Stanley REIT index (see Figure 3), there are two particular spikes in the ATR worth mentioning: the October 1998 spike that marked the first trough in a double bottom in the index, and the November 2001 spike that followed the post-September 11 trough. There are other minor spikes: the spring of 1999, the December 1999/January 2000 trough that formed the second trough of the double bottom mentioned above, and the larger of the three minor spikes in the fall of 2000. At a cursory glance, then, the ATR seems to provide clearer, more meaningful signals as to when prices are about to move explosively compared to using standard deviation alone. For his part, Gustafson credits the way that ATR encompasses so much data that is relevant to investors and traders, namely highs versus lows versus closes, plus the day-to-day fluctuations. Gustafson concludes, "There is no mathematical proof behind the ATR, but many traders feel it captures more relevant data for them to make decisions." I first came across ATR as it was being used by Teresa Lo of TrendVUE to trade options. Lo used the ATR to help determine optimal strike prices when purchasing options. For example, looking to buy a QQQ call with the QQQs closing at 30, traders using Lo's approach would take the day's ATR and subtract that amount to the close of 30. This new number would be rounded down to the nearest strike price in order to a) purchase an in-the-money option, and b) own an option that, because of the option's ATR, was less likely to move too far out-of-the-money before expiration. In the event of a put, the trader would add the ATR and round up to the nearest strike.
HISTORICAL VOLATILITYOne of the best trading strategies I've come across that uses volatility is the 10/100 historical volatility indicator. Authors Laurence Connors and Blake Hayward introduced their version of this historical volatility indicator in Investment Secrets Of A Hedge Fund Manager, but the basic approach to using historical volatility is relatively widespread among traders and money managers. Connors and Hayward felt so positive about their approach to historical volatility that they trademarked their indicator the Connors-Hayward Historical Volatility System. But while there is some originality to Connors and Hayward's creation of a robust indicator based on historical volatility, the concept of historical volatility and its use in trading is not new. Equis International refers to this strategy of comparing historical volatilities over different time frames as the "Historical Volatility Indicator" or HVI, which is the way the technique will be referred to here. Options traders have found historical volatility to be especially helpful. As Sheldon Natenberg observes in his Option Volatility And Pricing: "Even though one cannot know the future, if a trader intends to use a theoretical pricing model, he must try to make an intelligent guess about the future volatility. In option evaluation, as in other disciplines, a good starting point is historical data. What typically has been the volatility of the underlying over some period in the past?" As Natenberg defines it, historical volatility is the standard deviation of price changes as measured regularly over a period of time. Expressing this value as an annualized percentage makes the volatility measure "historic" (though both "realized" and "annualized" have been used as descriptions). The actual equation for historical volatility is no walk in the park for most nonmathematicians (it is available in both Natenberg's and Connors and Hayward's books, as well as through S&C). Fortunately, the HVI is present on many, if not most, charting software programs, and the actual trading system based on historical volatility is easily constructed on platforms such as MetaStock and TradeStation. In MetaStock, historical volatility can be derived as follows:
Historical volatility, N-period
Std(Log(C/Ref(C,-1)), N)* Sqrt(365)*100
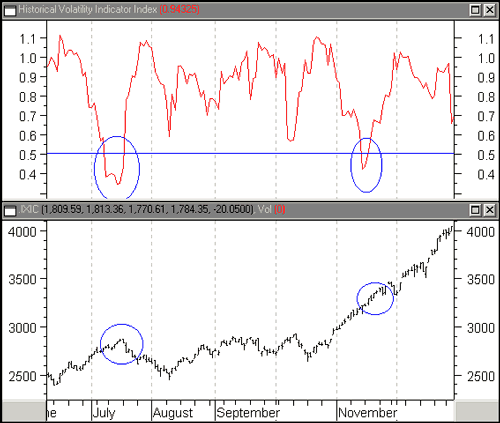
Ten-day and 100-day periods are necessary in order to build the HVI. Simply substitute 10 and 100 respectively for N, and then divide the 10-day historical volatility indicator by the 100-day historical volatility indicator. How does the Historical Volatility Indicator work? Generally speaking, when the 10-day historical volatility of a security is less than 50% of its 100-day historical volatility, then the security is considered due for a major price move as it returns toward its longer-term volatility trends. This notion of lower volatility paving the way for higher volatility is also behind trading using the VIX, as well as trading using Bollinger Bands. In addition, one of the most popular trading techniques — buying (or selling) volatility breakouts — is based on the same principle. Looking at the Nasdaq over the last few years, we can see some interesting areas where the Historical Volatility Indicator dipped below 0.5 (meaning that the 10-day historical volatility was less than 50% of the 100-day historical volatility). The first one in the chart provided came in July 1999. Here, we saw the Historical Volatility Indicator move below 0.5 with the Nasdaq at 2793 and moving in an uptrend. Ten days later, the upside gained a little over 1% when the Nasdaq topped out and began to fall. Thirty days later, the Nasdaq was down almost 11% at 2,490.
Figure 4: Nasdaq and historical volatility. Historical or annualized volatility indicators such as this one anticipate significant price moves.
There is another example of a mid-trend HVI signal in the Nasdaq (see Figure 4). This signal comes in November 1999 with the Nasdaq — which had broken out above resistance at 2913 two weeks before — trading at 3221. Thirty days later, the Nasdaq was up over 13% at 3658. This rally, of course, culminated in the legendary Nasdaq top of 5048 in March 2000. What is interesting in these two examples is that the Historical Volatility Indicator provided signals while prices were already in uptrends. In the first case, the drop in volatility set the stage for a price reversal. In the second case, the drop in volatility set up for a renewed advance (some might argue that this advance was the "bubble" advance) in the Nasdaq.
TRADING VOLATILITYOne of the problems with volatility-based indicators is that while some of them may do better jobs of anticipating major price moves, none actually suggests the likely direction. This was evident from our examples of the Historical Volatility Indicator. On one occasion, the volatility signal came in advance of a profitable short trade. On another, the volatility signal came in advance of a profitable long trade. Both occurred during uptrends in which prices had recently moved above resistance. So when the signal comes, how does a trader know which way to go? Various approaches have been used to combat this failing. One of the more popular is to use a moving average of prices to determine whether the trade initiated by the historical volatility signals will be on the long side or the short side. In this strategy, long trades are initiated when prices cross above a moving average, and short trades initiated when prices cross below the same moving average. For example, a long trade might be made when prices cross above a 20-day moving average and the HVI is less than 0.5 (or was less than 0.5 in some recent period, such as five to 10 days). The application of volatility studies to trading options is obvious. But even those who do not trade options can benefit from understanding the relationship between rising and falling volatility and price action. While the relationship is not as simple as some may suggest, in which rising volatility means one thing and one thing only, it's important to learn how volatility — truly the source of all price gains and losses — works to make and move markets.
David Penn may be reached at DPenn@Traders.com.
SUGGESTED READINGAchelis, Steven [2000]. Technical Analysis From A to Z, 2nd ed., McGraw-Hill.Bernstein, Peter [1996]. Against the Gods: The Remarkable Story Of Risk, John Wiley & Sons. Connors, Lawrence, and Blake Hayward [1995]. Investment Secrets Of a Hedge Fund Manager, McGraw-Hill. Gustafson, Gordon [2001]. "Which Volatility Measure?" Technical Analysis of STOCKS AND COMMODITIES, Volume 19: June. Natenberg, Sheldon [1994]. Option Volatility And Pricing, McGraw-Hill. Tanous, Peter J. [1997]. Investment Gurus, New York Institute of Finance. Wilder, J. Welles [1978]. New Concepts In Technical Trading Systems, Trend Research. Yamanaka, Sharon [2001]. "Average True Range," Working Money, December.
MetaStock (Equis International)
Current and past articles from Working Money, The Investors' Magazine, can be found at Working-Money.com.
|
Technical Writer for Technical Analysis of STOCKS & COMMODITIES magazine, Working-Money.com, and Traders.com Advantage.
| Title: | Traders.com Technical Writer |
| Company: | Technical Analysis, Inc. |
| Address: | 4757 California Avenue SW |
| Seattle, WA 98116 | |
| Phone # for sales: | 206 938 0570 |
| Fax: | 206 938 1307 |
| Website: | www.traders.com |
| E-mail address: | DPenn@traders.com |
Traders' Resource Links | |
| Charting the Stock Market: The Wyckoff Method -- Books | |
| Working-Money.com -- Online Trading Services | |
| Traders.com Advantage -- Online Trading Services | |
| Technical Analysis of Stocks & Commodities -- Publications and Newsletters | |
| Working Money, at Working-Money.com -- Publications and Newsletters | |
| Traders.com Advantage -- Publications and Newsletters | |
| Professional Traders Starter Kit -- Software | |
PRINT THIS ARTICLE

Request Information From Our Sponsors
- StockCharts.com, Inc.
- Candle Patterns
- Candlestick Charting Explained
- Intermarket Technical Analysis
- John Murphy on Chart Analysis
- John Murphy's Chart Pattern Recognition
- John Murphy's Market Message
- MurphyExplainsMarketAnalysis-Intermarket Analysis
- MurphyExplainsMarketAnalysis-Visual Analysis
- StockCharts.com
- Technical Analysis of the Financial Markets
- The Visual Investor
- VectorVest, Inc.
- Executive Premier Workshop
- One-Day Options Course
- OptionsPro
- Retirement Income Workshop
- Sure-Fire Trading Systems (VectorVest, Inc.)
- Trading as a Business Workshop
- VectorVest 7 EOD
- VectorVest 7 RealTime/IntraDay
- VectorVest AutoTester
- VectorVest Educational Services
- VectorVest OnLine
- VectorVest Options Analyzer
- VectorVest ProGraphics v6.0
- VectorVest ProTrader 7
- VectorVest RealTime Derby Tool
- VectorVest Simulator
- VectorVest Variator
- VectorVest Watchdog


