HOT TOPICS LIST
- Strategies
- Stocks
- Buy
- Investing
- Brokers
- Psychology
- Interviews
- Accumulate
- Sell
- Hold
- Spotlight
- Websites
- Candlestick Corner
- Gold & Metals
- Options Trading
LIST OF TOPICS
Recognizing Elliott Wave Patterns
04/29/02 01:59:10 PM PSTby Rudy Teseo
Elliott Wave Tutorial: Part II -- The name of the game is pattern recognition.
| Part I discussed the basic wave patterns, impulse and corrective. Part II will describe the patterns that must be recognized in order to do a thorough job of Elliott wave (EW) analysis. The following examples by no means include all the patterns you will encounter in your Elliott wave analysis, but represent those that appear most often. You need to know not only to what price levels the market will rise, but also what patterns to expect in your bar (candle) chart. The two main Elliott waves are motive and corrective. The motive wave is a five-wave configuration with waves 1, 3, and 5 in the direction of the trend. In a bull market you will expect each wave to be higher than the preceding one. Think of these as higher highs. In a bear market these waves will be descending; think of them as lower lows. The corrective waves, 2 and 4, will move in the opposite direction to the major trend. The motive wave has only one basic configuration, with several variations. These you will learn fairly quickly. Corrective waves, however, have many configurations, some very complicated. These will take longer to learn, but are necessary for a thorough wave analysis.
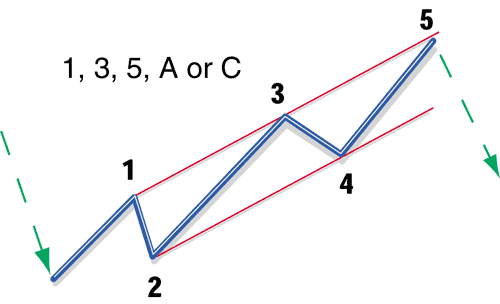
MOTIVE WAVESBasic motive wave (Figure 1): The basic wave is a five-wave configuration with waves 1, 3, and 5 in the direction of the trend, and waves 2 and 4 in the opposite direction. Wave 3 is normally the longest, but in no case can it be the shortest of the three. It may equal wave 1, but typically it is 161.8% of wave 1. If W3 equals W1, then W5 will usually be shorter. Wave 5 is typically 61.8% to 100% of wave 1.
Figure 1: Basic motive wave
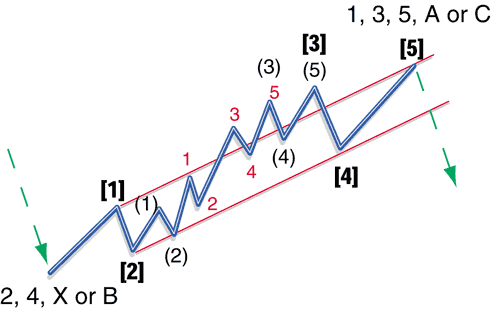
Extended motive wave (Figure 2): Any of the three motive waves may be extended, although wave 3 is the most common. An extended wave is much longer than either of the other two and takes much longer to develop. Thus, you will probably see waves of a lesser degree developing. Figure 2 shows a minor wave (1, 2 and so on) within an intermediate wave ((1), (2)) within a primary wave ([1], [2]). This is actually an extended 3 of an extended 3! This pattern is found more in stocks than in commodities. An extended wave will usually break through the normal channel that encloses a nonextended wave, as shown in Figure 2.
Figure 2: Extended motive wave
Relationships between alternate waves are usually reliable. If W1 is the extended one, then W2W5 will typically be 61.8% of W1. If W3 is extended, W5 usually equals W1. If W5 is extended, it will typically equal 161.8% of W1W3.
Truncated Fifth (Figure 3): Truncated fifths do not occur often, but you must be aware of them or you could determine a wrong count. A truncated (or failed) fifth is a fifth wave that does not return to the channel where it would normally end. This means that the correction will start earlier (at a higher price) than your projection had indicated.
Figure 3: Truncated fifth wave
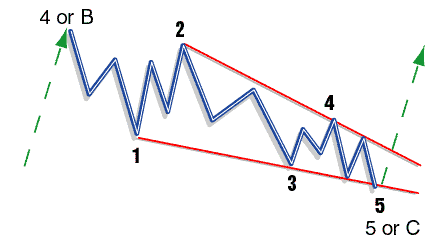
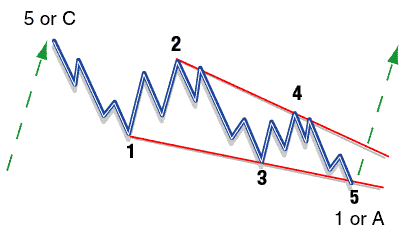
Diagonal Triangle Type 1 (Figure 4): This is also referred to as an ending diagonal, as it appears predominantly in waves 5 or C (the end of a pattern). Do not confuse it with a triangle, which is a corrective pattern. The important point to note in this pattern is that it is a 3-3-3-3-3 configuration — that is, three waves, three waves, three waves, three waves, three waves. The fifth wave (motive) would normally be a 1-2-3-4-5, as described in my previous article. A distinguishing feature of this wave is that W4 retraces into the price of W1, which is allowable as it is not a motive wave.
Figure 4: Diagonal triangle, type 1
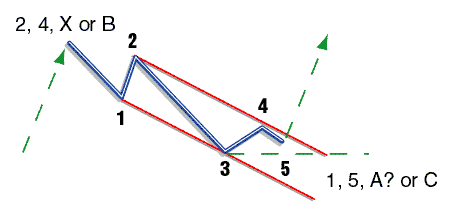
Diagonal Triangle Type 2 (Figure 5): This is also referred to as a leading diagonal as it appears most frequently in waves 1 and A. Again, don't confuse this with a corrective triangle. What distinguishes this pattern from a type 1 is the configuration, which is 5-3-5-3-5. Being a motive wave, the first wave is a 1-2-3-4-5.
Figure 5: Diagonal triangle type 2
CORRECTIVE WAVESCorrective waves appear in three basic patterns: zigzag, flat, and triangle. Within these three patterns are many variations and combinations, which makes this one of the most difficult areas of study. I always have a chart of all the patterns handy when I am analyzing a chart. If you are not dealing with Elliott wave every day, it is not easy to keep everything in your memory. When analyzing corrective waves, be aware of the guideline of alternation, which states that if W2 is a simple configuration, then W4 will probably be a complex one.
Zigzag (Figure 6): The zigzag pattern is very common and is aptly named. It is easily recognized by B being shorter than A, and C extending beyond A, giving it a zigzag shape (from the technical analysis indicator of the same name). It has a 5-3-5 configuration.
Figure 6: Zigzag pattern
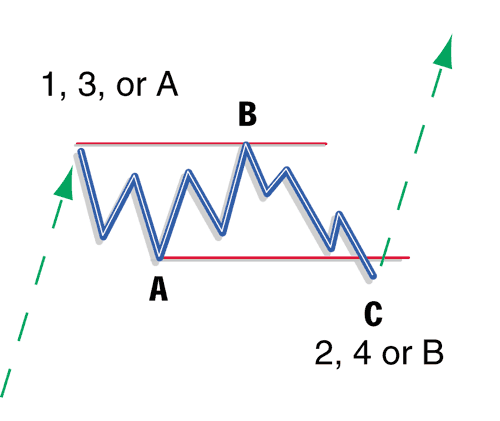
Flat (Figure 7): The flat is easily recognized, as the three waves are of approximately equal size and give the appearance of a consolidating pattern (which is often referred to as a flat or nontrending pattern). It has a 3-3-5 configuration.
Figure 7: Flat pattern
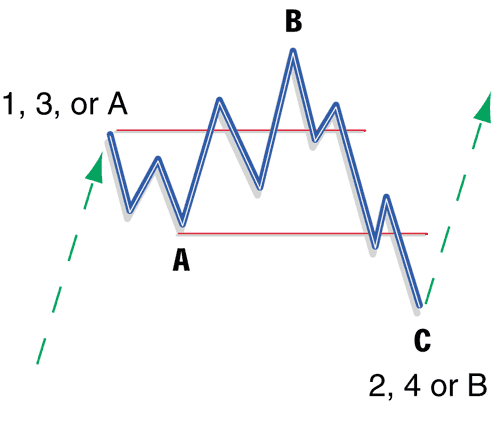
Expanded Flat (Figure 8): This pattern is a variation of the flat and is more commonly found. Wave B extends beyond the origin of wave A. This leads to a wave C, which is often 161.8% of wave A. It has a 3-3-5 configuration.
Figure 8: Expanded flat pattern
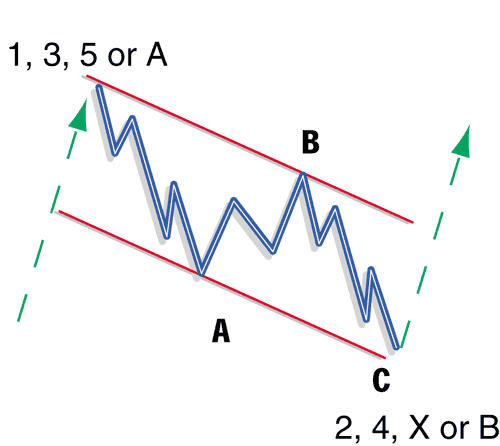
Triangles: Triangles appear in many configurations, but fortunately, they are the same triangles that chartists have been working with for years. But now, instead of watching a pattern develop and wondering where the breakout will be, you will understand the pattern within the triangle and can predict the direction of the breakout. All triangles are 3-3-3-3-3.
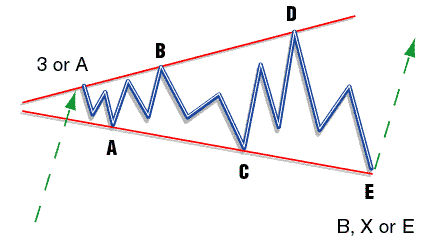
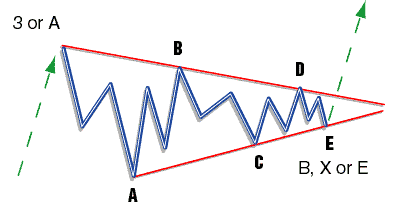
Symmetrical Triangle (Figure 9): The symmetrical triangle is bound by converging lines and may be expanding or contracting. In an expanding triangle (a megaphone shape), W1 will be the shortest and W5 the longest. In a contracting triangle, W1 will be the longest and W5 the shortest. The breakout is in the direction of the trend.
Figure 9a: Expanding triangle
Figure 9b: Contracting triangle
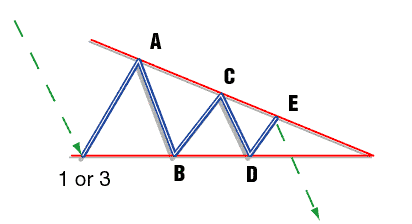
Descending Triangle (Figure 10): The descending triangle has a top that slopes down and a flat bottom. Chartists not using Elliott wave analysis normally expect this triangle to break out to the upside, considering the flat bottom as a support line. However, this is a corrective pattern and must be followed by a W3 or a W5 in the direction of the trend. Figure 10 is a pattern in a bear market. I chose this pattern to show that the breakout is dependent upon the succeeding wave, not the shape of the pattern itself.
Figure 10: Descending triangle
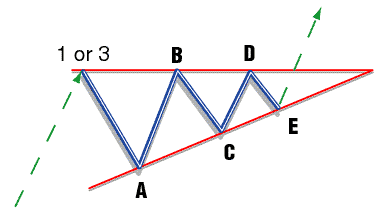
Ascending Triangle (Figure 11): The ascending triangle has a flat top and an upsloping bottom. Most chartists expect the breakout to be to the downside because they consider the flat top to be a resistance level. Figure 11 shows the pattern in a bull market and the breakout is to the upside because the continuing pattern must be in the direction of the trend.
Figure 11: Ascending triangle
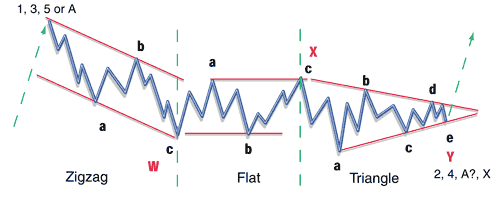
Combination or WXY (Figure 12): This pattern combines a zigzag (denoted wave W), followed by a flat (wave X), and ends with a triangle (wave Y). The configuration of each is the same as in the individual waves. This is one of the most complex patterns you will have to analyze. (All corrective patterns may combine to produce larger more complex patterns.) It is also very difficult to identify as it is developing. Many times you will not know for sure what pattern you are in until it's over!
Figure 12: Combination pattern
Patterns must be studied and understood until they can be recognized in the developing market. My next article, part III, will be devoted to channeling.
Rudy Teseo has taught courses in option trading and basics of stock charting. Contact him at rftess@juno.com.
Patterns reproduced courtesy of Prognosis Software Development.
SUGGESTED READINGPrognosis Software Development: www.elwave.com, e-mail: info@prognosis.nlTeseo, Rudy [2002]. "Counting Elliott Waves: Elliott Wave Tutorial: Part I," Working Money: March.
Current and past articles from Working Money, The Investors' Magazine, can be found at Working-Money.com.
|
Rudy Teseo is a private investor who trades stocks, options, and currencies. He has taught classes in technical analysis and option trading. He may be reached at rftess@optonline.net.
| E-mail address: | rftess@optonline.net |
PRINT THIS ARTICLE

Request Information From Our Sponsors
- VectorVest, Inc.
- Executive Premier Workshop
- One-Day Options Course
- OptionsPro
- Retirement Income Workshop
- Sure-Fire Trading Systems (VectorVest, Inc.)
- Trading as a Business Workshop
- VectorVest 7 EOD
- VectorVest 7 RealTime/IntraDay
- VectorVest AutoTester
- VectorVest Educational Services
- VectorVest OnLine
- VectorVest Options Analyzer
- VectorVest ProGraphics v6.0
- VectorVest ProTrader 7
- VectorVest RealTime Derby Tool
- VectorVest Simulator
- VectorVest Variator
- VectorVest Watchdog
- StockCharts.com, Inc.
- Candle Patterns
- Candlestick Charting Explained
- Intermarket Technical Analysis
- John Murphy on Chart Analysis
- John Murphy's Chart Pattern Recognition
- John Murphy's Market Message
- MurphyExplainsMarketAnalysis-Intermarket Analysis
- MurphyExplainsMarketAnalysis-Visual Analysis
- StockCharts.com
- Technical Analysis of the Financial Markets
- The Visual Investor

