HOT TOPICS LIST
- Strategies
- Stocks
- Buy
- Investing
- Brokers
- Psychology
- Interviews
- Accumulate
- Sell
- Hold
- Spotlight
- Websites
- Candlestick Corner
- Gold & Metals
- Options Trading
LIST OF TOPICS
INVESTING
The Bullish Bears Of Summer
07/02/02 04:05:06 PM PSTby David Penn
With stocks down and foreign currencies looking toppish, is there any hope left for a summer rally in equities?
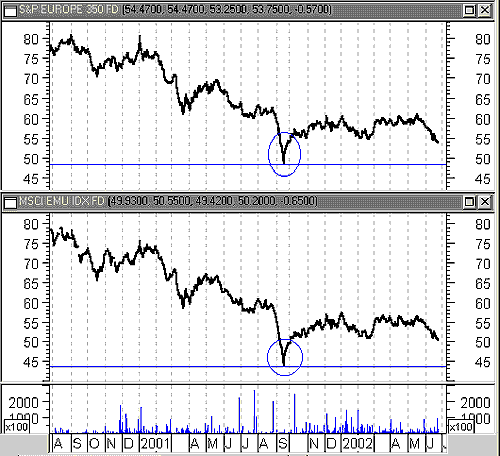
| Is a double bottom the cure for this year's summertime blues? Morgan Stanley investment strategist Barton Biggs seems to think so. As BusinessWeek recently reported, Biggs, a noted bear, sees potential upside in the way the major stock averages — both in the United States and in Europe — are testing the lows of September 2001. While giving the obligatory lip service to the fundamentals ("both the dividend-discount model and the forward yield-gap analysis . . . indicate that the US and European markets are now undervalued"), according to BusinessWeek, Biggs is joining a host of other analysts and strategists (including Edward Yardeni of Prudential Securities) in pointing to a big, old-fashioned double bottom that could eventually carry the Standard & Poor's 500 to as high as 1200 and take the Nasdaq as far as 2000. I first stumbled upon this double-bottom theory looking at the ishares of a number of European countries, as well as various and sundry European indexes. As Figure 1 shows, both the MSCI EMU Index Fund (EZU) and S&P Europe 350 Index Fund (IEU) put in initial bottoms in September 2001, along with many of the major stock markets around the world. While Europe as a whole has not suffered in 2002 the way the US has (particularly the Nasdaq 100, which has already dropped below its September 2001 lows), European stocks have been declining ever since an early January peak (both the EZU and IEU gained almost 32% from the September bottom to the January peak). Currently down about 13%, both the EZU and IEU have some distance to go before a serious test of the September lows takes place. But the trends are down and, if the action in the US markets is any indication at all, that test of the September lows will come sooner than later.
Figure 1: European shares are testing year-to-date lows. Will the September 2001 lows be far behind?
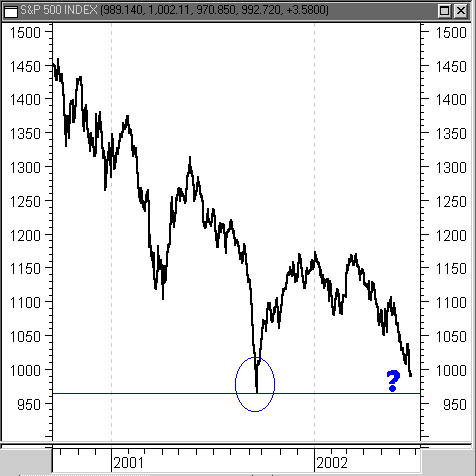
The S&P 500 is much closer to testing its September 2001 lows than are the European indexes, and may be the first indication in the event that stocks rally over the next few months. In fact, the S&P 500 has almost retraced the entirety of its advance from 965 in September to 1155 in early January, as it hovers above 970 in late June (Figure 2). In order for a double bottom to take place, the S&P 500 will have to find support in the 960-70 range. Fortunately for the double-bottom case, 960-70 represents not only the correction lows of September 2001, but also the correction lows from October 1998 — the market crash in the wake of the Long-Term Capital Management scandal and Russian debt default.
Figure 2: The S&P 500 is mere points away from a test of its September 2001 lows. Should the September lows not hold, any further declines could be sharp. The next long-term correction low is 767, another 20% down, which corresponds to the spring 1997 lows that occurred during the Asian crisis.
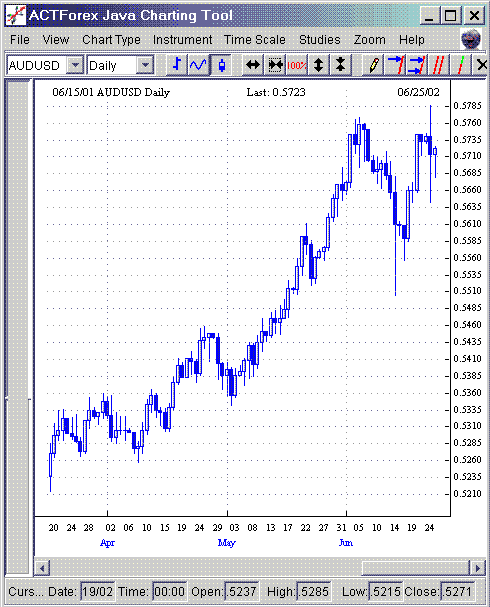
GREENBACK COMEBACK?An additional argument that could be deployed in support of the summer equities rally is the growing weakness of foreign currencies. Another way of putting this is that the US dollar — which has fallen some 8% from its mid-January peak of around 120 on the US Dollar Index — looks like it might make a countertrend rally. While this is difficult to see on the chart of the US Dollar Index — in which the greenback looks like the "Short-Trade of the Month" — the possibilities for dollar bullishness seem more realistic when seen through a forex lens. The AUDUSD (Australian dollar/US dollar) currency pair is one that suggests the possibility of a dollar rally, which might presage a rally in US equities (Figure 3). The Australian dollar has been in a significant upward trend since the beginning of 2002, rising from a low of 0.5050 in late January to an intraday high of 0.5768 in early June (a 718-pip move, or about $7,180 per currency pair traded). However, after making its early June high, the AUD corrected sharply before making another run at its year-to-date high. The extreme in topping and bottoming tails that accompany this second top suggest a high degree of both volatility and potential accumulation/distribution. If AUDUSD fails to make a new high above 0.5770, then it is likely that the "smart money" was doing the distributing at this top.
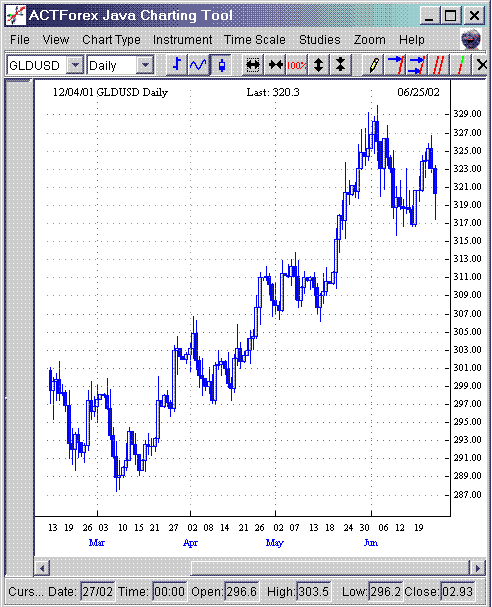
Figure 3: After a major bull market in the first half of 2002, AUDUSD looks more than ready to retrace. Other evidence of a possible short-term strengthening of the dollar comes in the form of the US dollar price of gold (expressed as GLDUSD in forex). It's not surprising that gold has been in a rare bull market since bottoming in September 1999. In 2002, gold prices have continued to climb, with the dollar price of gold moving from 278 at the beginning of the year to a high of 328 in early June, an 18% advance (Figure 4). However, as with the AUDUSD currency pair noted previously, gold's advance appears to have topped out as well, at least for the time being. In fact, GLDUSD looks, in some ways, very much like AUDUSD.
Figure 4: The declining dollar price of gold here at the top also supports the dollar-backed equities-rally theory.
There is still dollar weakness that undercuts the dollar-rally equities-rally thesis, however. Greenback weakness remains pronounced against both the yen and the euro. This suggests that the dollar may be on the verge of regaining some of the value it lost in 2002, but this is likely to come at the expense of commodities prices, as opposed to the other two main currencies. Because the Australian dollar is considered one of the more commodity-influenced currencies that is widely traded (the other, to a lesser degree, is the Canadian dollar), the example of potential dollar strength vis-a-vis the Aussie supports the possibility of a dollar rally. Another commodity-influenced currency against which the dollar has been gaining recently is the South African rand (USDZAR).
CLIMBING THE WALL OF WORRYI'm generally not a fan of the "summer rally." As I suggested in a Working Money article last autumn, real summer rallies — which I define as a significant market advance from Memorial Day to Labor Day — are relatively rare. In fact, the evidence shows that summer rallies were far more common and powerful during the 1950s and 1980s than they were in the 1960s, 1970s, and 1990s. Too often, the call for a "summer rally" is a cheap disguise for an anticipated spring rally that never happened or an even more anticipated fall rally that probably doesn't stand much of a chance either. Currently, the S&P 500 and Dow Jones industrials are both down almost 10% for the summer, the AMEX Major Market Index is down somewhat less at 8%, and the Nasdaq is down over 14%. But perhaps these negative early-summer returns might be the source of a mighty summer rally. With corporate wrongdoings a regular part of the evening business news and a new terrorist warning every other week, it is easy to imagine that many investors have decided that if ever there was a time to "sell in May and go away," the summer of 2002 just might be that time. As market history has proven time and time again, it is often out of this kind of complacency and market apathy that bull markets are born — whether they are little more than countertrend advances or cyclical bull moves inside a greater bear trend.
David Penn may be reached at DPenn@Traders.com.
SUGGESTED READINGPenn, David [2001]. "A Spring And Summer Not To Remember," Working Money, September.MetaStock (Equis International); ACT Forex Java Charts
Current and past articles from Working Money, The Investors' Magazine, can be found at Working-Money.com. |
Technical Writer for Technical Analysis of STOCKS & COMMODITIES magazine, Working-Money.com, and Traders.com Advantage.
| Title: | Traders.com Technical Writer |
| Company: | Technical Analysis, Inc. |
| Address: | 4757 California Avenue SW |
| Seattle, WA 98116 | |
| Phone # for sales: | 206 938 0570 |
| Fax: | 206 938 1307 |
| Website: | www.traders.com |
| E-mail address: | DPenn@traders.com |
Traders' Resource Links | |
| Charting the Stock Market: The Wyckoff Method -- Books | |
| Working-Money.com -- Online Trading Services | |
| Traders.com Advantage -- Online Trading Services | |
| Technical Analysis of Stocks & Commodities -- Publications and Newsletters | |
| Working Money, at Working-Money.com -- Publications and Newsletters | |
| Traders.com Advantage -- Publications and Newsletters | |
| Professional Traders Starter Kit -- Software | |
PRINT THIS ARTICLE

|

Request Information From Our Sponsors
- StockCharts.com, Inc.
- Candle Patterns
- Candlestick Charting Explained
- Intermarket Technical Analysis
- John Murphy on Chart Analysis
- John Murphy's Chart Pattern Recognition
- John Murphy's Market Message
- MurphyExplainsMarketAnalysis-Intermarket Analysis
- MurphyExplainsMarketAnalysis-Visual Analysis
- StockCharts.com
- Technical Analysis of the Financial Markets
- The Visual Investor
- VectorVest, Inc.
- Executive Premier Workshop
- One-Day Options Course
- OptionsPro
- Retirement Income Workshop
- Sure-Fire Trading Systems (VectorVest, Inc.)
- Trading as a Business Workshop
- VectorVest 7 EOD
- VectorVest 7 RealTime/IntraDay
- VectorVest AutoTester
- VectorVest Educational Services
- VectorVest OnLine
- VectorVest Options Analyzer
- VectorVest ProGraphics v6.0
- VectorVest ProTrader 7
- VectorVest RealTime Derby Tool
- VectorVest Simulator
- VectorVest Variator
- VectorVest Watchdog


