HOT TOPICS LIST
- Strategies
- Stocks
- Buy
- Investing
- Brokers
- Psychology
- Interviews
- Accumulate
- Sell
- Hold
- Spotlight
- Websites
- Candlestick Corner
- Gold & Metals
- Options Trading
LIST OF TOPICS
THE CHARTIST
The Andrews Pitchfork Vs. Speed Resistance Lines
07/16/02 03:33:53 PM PSTby Sharon Yamanaka
Can you ever have too much support?
| One of the pitfalls of using technical analysis to gauge stock movement is that it often depends on whether a stock is trending. In the early stages of a trend, there is often a hotbed of contention, especially now in the erratic, often seemingly psychotic movement of stock prices, whether or not a stock is beginning a new trend. So there would be an advantage in using a system that gets you into the market after a trend has been established. The question then becomes, if you've missed the beginning of a trend, how long will the trend continue, and is it worth investing in a stock that's already gone up or down significantly? Andrews pitchforks and speed resistance lines are purported to solve this problem by creating support/resistance lines around a trending stock. Support and resistance lines are pretty much what they sound like: They mark areas that a stock price tends not to penetrate. If the area is below a stock price and the stock seems to bounce off the line rather than fall below it, then it's a support line. If the line is above the current stock price and the price seems unable to rise above it, then it's a resistance line. Often, when a stock rises above a resistance line, the resistance line becomes a support line, and vice versa. Andrews pitchforks and speed resistance lines have a lot in common. Both give clear entry and exit points, and both are visual forms of analysis, simple to create and simple to use. But they generate their support/resistance lines using different theories and parameters, and they also appear quite different. Andrews pitchforks create parallel lines above and below a trending stock, while speed resistance lines radiate outward from a significant high or low point. You can go to a number of interactive charting websites and draw or generate either analysis, and there is at least one website, StockCharts.com, that will automatically draw a pitchfork around specified points. Here is how to apply both systems.
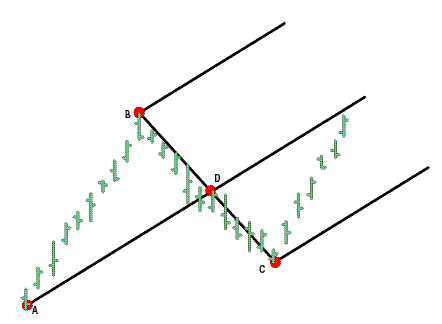
DRAWING ANDREWS PITCHFORKSTo create an Andrews pitchfork, pick three significant points. In an uptrend this would be a low (point A), high (point B), and low (point C). Find the midpoint between point B and C, labeled D in the figure, and then draw the center line from low point A through point D. The outer lines, or "tines," of the pitchfork are drawn parallel to the center line starting at points B and C (Figure 1).
Figure 1: Andrews pitchfork.
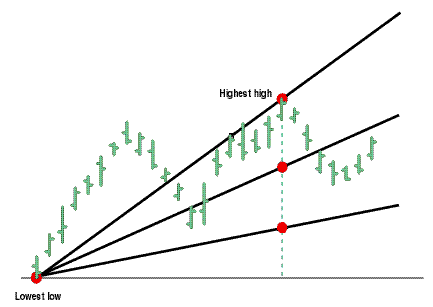
DRAWING SPEED RESISTANCE LINESTo create speed lines for an uptrend, pick the lowest low and the highest high. Connect the two points, then draw a vertical line down from the highest point to the level of the lowest point (blue dotted line). Divide the line into thirds and draw the middle lines by connecting the lowest point to the points on the dotted line. These lines are now your support/resistance areas (Figure 2).
Figure 2: Speed resistance lines.
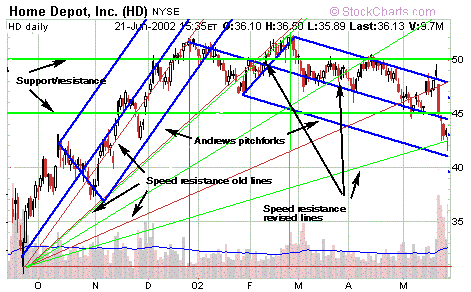
AN EXAMPLE USING HOME DEPOTTheoretically, Andrews pitchforks create a trend based on the volatility of the stock. A stock may have a pattern in its trends — up 10, down 5, up 10, and so on. If a channel can be found around these tendencies, then they can be identified and exploited. Speed resistance lines, on the other hand, are loosely based on the Gann theory of one-third retracements. (Although there's no scientific reason for it to happen, stocks will often retrace about one third of their recent gains, as opposed to a complete reversal.) Shouldn't two such different theories give completely different buy and sell signals? I tested them with a number of different stocks, and Home Depot (HD) gave representative results. Although only someone trying to make a point would do this (like me), I placed all my support/resistance lines onto Home Depot's (HD) daily chart (Figure 3). I believe all these systems are completely valid, yet they create quite a grid(lock) of confusion. How can so many support and resistance lines exist and still be valid? Too many lines, not enough stock —
Figure 3: Eight months' worth of Home Depot divided into an assortment of support and resistance lines. Going back to the basics, in order to properly apply these methods, I began with a simple chart (Figure 4).
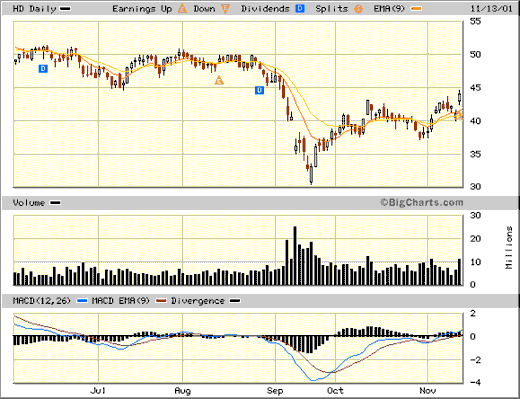
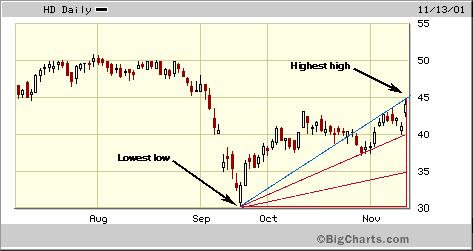
Figure 4: Daily chart of Home Depot from June 2001 to November 13, 2001. Home Depot had been going up from mid-September until the first week of October, and then it began drifting sideways. I waited to apply speed resistance lines until the stock began going up again, establishing a definite uptrend. Figure 4 shows Home Depot hitting a new high on November 13. Two common indicators, the exponential moving average (EMA) and the moving average convergence/divergence (MACD), showed the beginnings of an uptrend. Then I was able to apply my systems. I started with speed resistance lines (Figure 5).
Figure 5: Speed resistance lines drawn from the September low to the most recent high on November 13. By connecting the lowest low to the highest high and drawing in the speed resistance lines, I can see that the stock is going up within the boundaries of the first third of the lines. That looks good to me, and I can buy in now with the expectation that the stock will continue to rise within the first third of the speed resistance lines. At this point, this is a $5 fluctuation in price. If I turn out to be wrong, I would have a stop-loss around $40, which would move upward continually as the stock moved upward within the speed resistance lines. Then, I applied an Andrews pitchfork to the same time span of Home Depot (Figure 6).
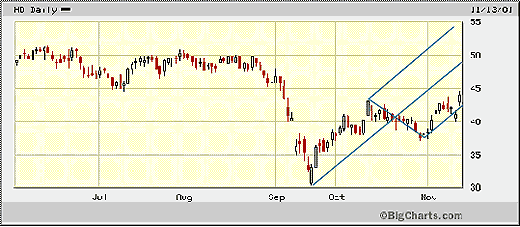
Figure 6: Andrew's pitchfork applied to Home Depot, from the September low to the November 13th high. I adjusted my lines a bit in order to get a better fit. I wanted a slightly gentler slope than I would have gotten by simply connecting highs and lows. Even with the adjustment, the uptrend is quite steep, and the stock's price is clinging to the lower tine of the pitchfork. I needed to wait a few days and see if the stock continued upward or broke through the lower pitchfork boundary; at that point, I would look to buy in around 45.
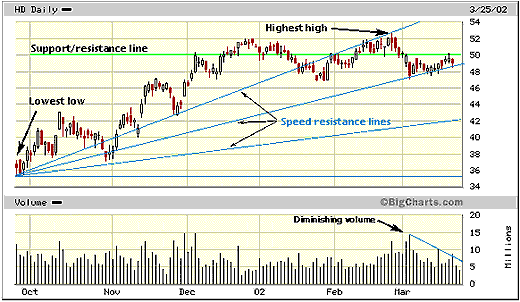
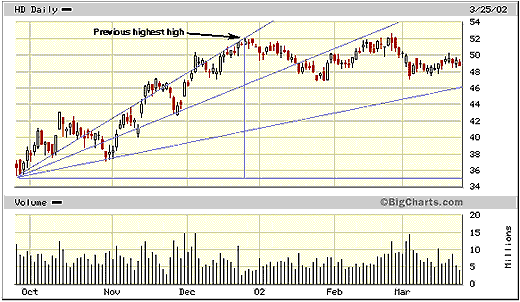
THE PROOF OF THE PUDDINGThe speed resistance lines are constantly redrawn; currently they go from the lowest low occurring in mid-September to the highest high, which occurred toward the end of February. Note that a lot of candlesticks in the earlier third of the chart are above the highest line. The previous high occurred at the end of December 2001, and at that time the lines were at a steeper angle. That they were redrawn at a lesser slope tells me that momentum for HD is slowing, as does the current stock price, which is now at the lower end of its speed resistance band. I've also drawn in a support/resistance line at 50. Now I can see a moment of reckoning coming for HD as its trading range narrows and volume declines. Either HD will break above the wedge it's forming and the one-third retracement predicted by the speed resistance lines will hold, or it will break below, losing further momentum, and perhaps go down another third before reversing. At this point the speed resistance lines have been in effect for about six months (Figure 7), and the one-third retracement is quite large, over $7. I wouldn't want to wait to see if it was going to hold on the lower end if I could sell a little higher up. I would prefer to sell around 50 at this point (Figure 8).
Figure 7: Six-month chart of Home Depot, showing the outcome of the speed resistance lines.
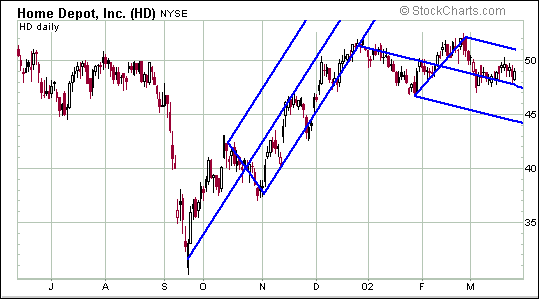
Figure 8: Original speed resistance lines drawn from the previous highest high. Note how the stock has fallen into the middle third of the lines, and also how well the stock conforms to the lines. HOW DID THE ANDREWS PITCHFORK FARE?In this section, I switched to a different website, StockCharts.com, from BigCharts.com because StockCharts draws Andrews pitchforks automatically. There, you can pick points A, B, and C, and the program automatically draws the pitchforks. It allows you to adjust the points after they are placed. In Figure 9, the stock fell out of the trend channel at the end of December. At that point, if I'd sold the stock it would have been around 50. This is about the same price I would have sold at had I used speed resistance lines, only I would have sold three months earlier. I've tentatively drawn a second pitchfork going in a downtrend, although the stock isn't necessarily in a downtrend at this time.
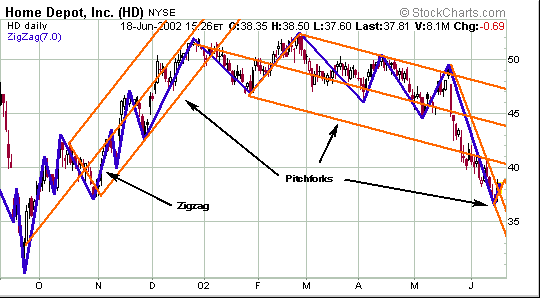
Figure 9: Andrew's pitchfork applied to Home Depot for a six-month period. A FURTHER REFINEMENT TO PITCHFORKSI've followed through one more time using Andrews pitchforks in order to show the use of zigzag. Zigzag is a way to filter out noise, or daily fluctuation in a stock's trading price that interferes in seeing a larger trend. Technically not an indicator, zigzag will be set at a certain percentage and, using highs and lows from the OHLC daily bar chart, will continue along a set trend until the change from high to low is greater than the set percentage. At this time, zigzag will reverse and start a new trend. For example, in Home Depot, I set the zigzag at 7%. In mid-May with a price of $45, the zigzag will not reverse until the high/low prices change by more than $3.15. The zigzag feature is also useful in picking out points A, B, and C when drawing pitchforks. Figure 10 shows a continuation of the pitchfork started in March. It held, and afterward Home Depot continued down, breaking out of the channel in mid-May, declining even more. With zigzag added (purple lines), patterns can be seen in the rise and fall of the stock price. Breaks in these wave-like patterns should be taken as a warning of a change in the stock's movement.
Figure 10: Follow through.
Figure 10 shows HD breaking downward past an expected reversal at 42 in mid-May. According to the pitchforks, the stock was beginning an even steeper downward pattern. Had you shorted the stock around 50, after it became clear that the stock was in a downward trend, you would have been in a good position. Finally, Figure 10 shows the start of a third pitchfork, perhaps not ever destined to become a true pitchfork, based on the points A, B, and C indicated by zigzag.
RECAPI've shown how to apply Andrews pitchforks and speed resistance lines and followed through, updating and amending their support and resistance lines on Home Depot's stock as it matured. The systems are intended to give visual parameters for a trending stock so that logical entry and exit points can be determined. Concentrating on the differences between the systems, I've found that:
Which way is best? That depends on the market, the stock, and the temperament of the individual investor. And what about the multitude of hodge-podge, contradictory, overlapping support/resistance lines generated? Well, once analyzed, the confusion fades away.
Sharon Yamanaka may be reached at SYamanaka@Traders.com. Charts and data sources: StockCharts.com, BigCharts.com.
Current and past articles from Working Money, The Investors' Magazine, can be found at Working-Money.com. |
| Title: | Staff Writer |
| Company: | Technical Analysis, Inc. |
| Address: | 4757 California AVE SW |
| Seattle, WA 98116 | |
| Phone # for sales: | 206 938 0570 |
| Fax: | 206 938 1307 |
| Website: | www.Working-Money.com |
| E-mail address: | syamanaka@traders.com |
Traders' Resource Links | |
| Charting the Stock Market: The Wyckoff Method -- Books | |
| Working-Money.com -- Online Trading Services | |
| Traders.com Advantage -- Online Trading Services | |
| Technical Analysis of Stocks & Commodities -- Publications and Newsletters | |
| Working Money, at Working-Money.com -- Publications and Newsletters | |
| Traders.com Advantage -- Publications and Newsletters | |
| Professional Traders Starter Kit -- Software | |
PRINT THIS ARTICLE

Request Information From Our Sponsors
- StockCharts.com, Inc.
- Candle Patterns
- Candlestick Charting Explained
- Intermarket Technical Analysis
- John Murphy on Chart Analysis
- John Murphy's Chart Pattern Recognition
- John Murphy's Market Message
- MurphyExplainsMarketAnalysis-Intermarket Analysis
- MurphyExplainsMarketAnalysis-Visual Analysis
- StockCharts.com
- Technical Analysis of the Financial Markets
- The Visual Investor
- VectorVest, Inc.
- Executive Premier Workshop
- One-Day Options Course
- OptionsPro
- Retirement Income Workshop
- Sure-Fire Trading Systems (VectorVest, Inc.)
- Trading as a Business Workshop
- VectorVest 7 EOD
- VectorVest 7 RealTime/IntraDay
- VectorVest AutoTester
- VectorVest Educational Services
- VectorVest OnLine
- VectorVest Options Analyzer
- VectorVest ProGraphics v6.0
- VectorVest ProTrader 7
- VectorVest RealTime Derby Tool
- VectorVest Simulator
- VectorVest Variator
- VectorVest Watchdog

