

HOT TOPICS LIST
- Strategies
- Stocks
- Buy
- Investing
- Brokers
- Psychology
- Interviews
- Accumulate
- Sell
- Hold
- Spotlight
- Websites
- Candlestick Corner
- Gold & Metals
- Options Trading
LIST OF TOPICS
THE CHARTIST
Using Breakdowns
07/23/02 04:27:57 PM PSTby Len Yates
Breakdowns are handy patterns to keep an eye on when you're trading
| Pattern trading is one of the most interesting ways to trade the markets. And one of the most reliable patterns to trade is a breakdown, which occurs when a stock experiences a swift selloff. Humans have a tendency to trickle into things — as in an entry into a market — but rush out in a stampede — as in an exit from a tumbling market. Sometimes, a news announcement or a rumor is all it takes to trigger a ministampede when the news is perceived to be more significant than it really is. These little (or sometimes large) selloffs can be traded profitably. I have found that breakdowns are more reliable when the stock has previously experienced a significant runup over the past few months. Profit-taking may be the reason, as investors are more apt to sell a stock in which they are showing a profit. And once they see their stock begin to drop, it may hasten an immediate sell decision, as traders fear any further loss of profits. Thus, I prefer to focus on uptrending stocks that have just broken their trendline.
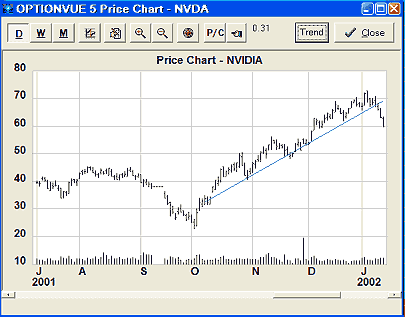
CATCHING A SELLOFFOf course, it's important to catch a selloff early while there is still plenty of potential downside. Figure 1 is a good example, using a closely hugging trendline like that shown in the chart of NVIDIA (NVDA). This is also what I would refer to as a "high-quality" uptrend, where the trend is well defined by a series of lows in a straight line, and the stock progresses neatly upward in stairstep fashion. Then, when the trendline is violated, it stands out clearly. At the least, investors who time the markets could use a breakdown signal to sell holdings they may have in those particular stocks, taking profits before it's too late.
It's also fun to play these breakdowns by going short. My favorite way of playing this type of market is to buy put options. Since the position will only be held for a few days, the nearby at-the-money contracts are usually suitable. I recommend using a strictly disciplined trailing stop from inception of the position. If the stock moves your way at first and you see a gain, you don't want to let that gain slip away. (Sometimes these selloffs end abruptly in a quick rebound.) And if the stock moves the wrong way from inception, it's usually best to admit the breakdown was false and get out quickly. (After that, sometimes the stock will move sideways and upward for a few days, and then break down again, this time for real. You can always jump aboard again at that point.) One factor that contributes to the success of this approach is the potentially large number of investors also noticing the breakdown. Many traders use trendlines. These traders will notice the breakdown and possibly place trades that will exacerbate the move. You just want to be in your position before the bulk of the crowd, if possible.
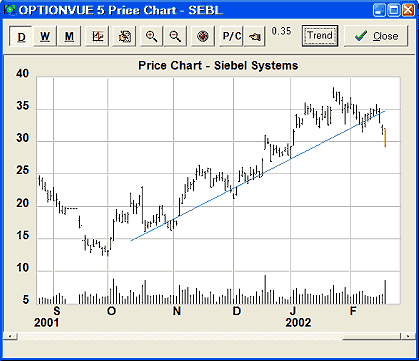
HEAD AND SHOULDERS BREAKDOWNSThe breakdown shown in Figure 1 is what I call a straight breakdown — that is, when the stock goes straight from making a new high down to violating the trendline. There is another form of breakdown that is even more reliable to trade. That one occurs when the stock experiences a sharp selloff from a new high, then recovers a little for several days in a sideways or upward sloping ramp, then falls again, essentially forming a right shoulder. Short positions opened as the stock begins to fall off the right shoulder are indeed high-reliability trades. See the chart of Siebel Systems (SEBL) (Figure 2).
SEBL continued to fall for several days after breaking this high-quality trendline off a right shoulder formation, turning this trade into a home run. While breakdowns don't always go as well as the one in Siebel did, a closely followed trailing stop can help ensure the home runs you occasionally hit will more than make up for the occasional strikeouts.
Len Yates is president and chief programmer of OptionVue Systems International, a leading developer of options trading software and services. He is also an active options trader, author, and speaker.
SUGGESTED READINGYates, Len [1988]. "Playing The 'Somewhats,'" Technical Analysis of Stocks & Commodities, Volume 6: December._____ [1986]. "Succeeding With Options, Part 1," Technical Analysis of Stocks & Commodities, Volume 4: June. _____ [1986]. "Succeeding With Options, Part 2," Technical Analysis of Stocks & Commodities, Volume 4: July.
Charts courtesy of OptionVue
Current and past articles from Working Money, The Investors' Magazine, can be found at Working-Money.com. SIDEBAR: TOOLS OF THE TRADE OptionVue 5 contains a feature that can search for, and alert you to, stocks exhibiting breakdown patterns. It's the Yates Break Search feature. Besides looking for trendline violations (of more than 1.6%), it can also find patterns where the stock has experienced a sharp selloff, then a brief recovery period, and has begun to fall again. (The Siebel breakdown in Figure 2 actually qualified under both of these search methods.) The program can be used to restrict its recommendations to only those stocks that experienced a significant runup over the past several months. Trendlines are automatically fitted into this search algorithm, so you do not have to place trendlines manually. When asked to restrict its alerts to only those stocks with a prior runup, the software may experience dry periods lasting two or more weeks during which there are no signals. These periods usually coincide with general upswings in the market. Consequently, I might suggest that playing the breakdowns can be a nice complement to managing a portfolio of stocks. When your stocks are going up, enjoy it. When the market turns sour, an occasional breakdown short play can help offset losses from your stocks, and alleviate the boredom. Not every breakdown alert should be traded. You should view price charts of the candidates and make qualitative judgments. For example, if a stock has recently made a new high and then come down to, and dipped just beneath, the trendline, you might want to see if the stock drops more convincingly beneath the trendline before taking a short position. Many times, a stock rallies from this point. It's possible the stock will rally above the trendline, form a right shoulder, and then break hard, creating the highest-quality entry point. Another thing to look for is the quality of the uptrend. A higher-quality uptrend usually precedes a higher-quality breakdown. In OptionVue 5, when the Trend button is clicked to display an automatically fitted trendline, the price chart also displays a number in the upper section to the right of the buttons. This number (in Figure 2, 0.35 for example) represents the quality of the trend. The lower the number, the better the trend quality. While high-quality breakdowns don't come along with great frequency, they do provide a good success rate if you can get aboard with a short position early. — LY
|
PRINT THIS ARTICLE

Request Information From Our Sponsors
- StockCharts.com, Inc.
- Candle Patterns
- Candlestick Charting Explained
- Intermarket Technical Analysis
- John Murphy on Chart Analysis
- John Murphy's Chart Pattern Recognition
- John Murphy's Market Message
- MurphyExplainsMarketAnalysis-Intermarket Analysis
- MurphyExplainsMarketAnalysis-Visual Analysis
- StockCharts.com
- Technical Analysis of the Financial Markets
- The Visual Investor
- VectorVest, Inc.
- Executive Premier Workshop
- One-Day Options Course
- OptionsPro
- Retirement Income Workshop
- Sure-Fire Trading Systems (VectorVest, Inc.)
- Trading as a Business Workshop
- VectorVest 7 EOD
- VectorVest 7 RealTime/IntraDay
- VectorVest AutoTester
- VectorVest Educational Services
- VectorVest OnLine
- VectorVest Options Analyzer
- VectorVest ProGraphics v6.0
- VectorVest ProTrader 7
- VectorVest RealTime Derby Tool
- VectorVest Simulator
- VectorVest Variator
- VectorVest Watchdog