HOT TOPICS LIST
- Strategies
- Stocks
- Buy
- Investing
- Brokers
- Psychology
- Interviews
- Accumulate
- Sell
- Hold
- Spotlight
- Websites
- Candlestick Corner
- Gold & Metals
- Options Trading
LIST OF TOPICS
MARKET UPDATE
When Will This Cruel Bear Market Be Over?
07/23/02 04:17:51 PM PSTby Tim W. Wood, CPA
The secrets of cycles combined with Dow Theory is a powerful combination for market forecasting.
| In the November 2001 Technical Analysis of STOCKS & COMMODITIES, I suggested that a move in late 2002 would take the Dow Jones Industrial Average (DJIA) and the Standard & Poor's 500 below the 1998 four-year cycle lows. As of this writing (July 16, 2002), this forecast has come to fruition for the S&P 500 and I am certain the DJIA will follow soon. The 1998 four-year cycle lows occurred at 7615 on the DJIA and 952 on the S&P 500. Any four-year cycle that tops in 20 months or less has historically taken out the previous four-year cycle low. Going back to 1896, there have been five times when the four-year cycle topped in 20 months or less, and every one of these five cycles took out the previous four-year cycle low. History has proved again to be the best teacher. Take the bull market of 1974 through the 2000 top: The four-year cycle tops occurred in 17 months for the S&P 500 and 16 months for the DJIA. Now, with the S&P 500 below the 1998 four-year cycle lows and the DJIA soon to follow, you will see the sixth occurrence of this pattern.
A LITTLE ABOUT DOW THEORYSome background on Dow theory will help illustrate my conclusions. According to Charles Henry Dow, "There are three movements of the averages, all of which may be in progress at one and the same time."
Dow theorist George Schaefer adds to this idea: "The first, and most important of these three, is the 'Primary Trend' — the long-term upward or downward movement in the averages, which is generally referred to as the primary bull or primary bear market."
THE COMBINATIONAs I read about the bull and bear markets of the late 1800s and very early 1900s, it has become apparent that the bull markets Charles Dow wrote about were the upward movements of the four-year cycle and the bear markets were the downward movements of the four-year cycle. As our country has become more sophisticated and more people have started investing, the bull and bear periods have become longer. Bull and bear markets evolved into a series of multiple four-year cycle periods. The bull market from 1921 to 1929 was a period of two four-year cycles. The low in November 1929 was a four-year cycle low. The rally, or secondary reaction, that followed was the upside of a four-year cycle that topped in only five months. Again, any top that has occurred in 20 months or less has historically taken out the previous four-year cycle low. Once this secondary reaction was over, the DJIA moved below the previous four-year cycle low and into the 1932 four-year cycle low, which also proved to be the bear market bottom. The 1921 to 1929 bull market advanced a total of 568% from the 1921 four-year cycle low of 67 on the DJIA to the 1929 four-year cycle top at a high of 381 on the DJIA. The bear market that followed declined 108% of the previous bull market advance. The next great bull market began with the four-year cycle low in 1942 and ran to the four-year cycle top in 1966. That time, the primary bull market made up a series of six four-year cycles. The bear market that followed was also a series of four-year cycles. From the 1966 four-year cycle low, the bear market moved down into the 1974 bear market low. This was a sequence of two four-year cycles. This second great bull market advanced a total of 1,076% from the 1942 four-year cycle low of 93 on the DJIA to the 1966 four-year cycle top at a high of 1001. The bear market that followed ran from the 1966 high to the 1974 four-year cycle low of 570 on the DJIA. That was a 47% decline of the previous bull market advance. From a cyclical perspective, the latest and greatest bull market began with the 1974 four-year cycle low and ran to the recent four-year cycle top in January 2000. This primary bull market made up a series of seven four-year cycles. This great bull market advanced a total of 2,061% from the 1974 four-year cycle low of 570 on the DJIA to the January 2000 high of 11,750 DJIA. And the bear market that followed is just beginning.
HOW LONG WILL THE BEAR MARKET LAST?Each bull and bear market has been a longer series of four-year cycles, and the percentage advancement of each bull market has been roughly double the previous bull market's percentage advancement. The bear markets have indeed lengthened in terms of the series of the number of four-year cycles, but not in terms of the magnitude of the decline. I strongly doubt we can count on the magnitude of the current decline being any smaller than it has been in the past. Now let's focus on the bear market declines. The 1921 to 1929 bull market was eight years in duration, and the 1929 to 1932 bear market was three years. The bear market duration was 37.5% of the preceding bull market. The 1942 to 1966 bull market was 24 years in duration, and the 1966 to 1974 bear market was eight years. That bear market duration was 33.3% of the preceding bull market. The last bull market ran from 1974 to 2000, and was 26 years in duration. Some argue that the last bull market began in 1982. From a cyclical perspective, I disagree. The bull market broke out in 1982 and became apparent. From my viewpoint, a bull market begins simultaneously with the same four-year cycle low that concludes the bear market; the current bear market is just beginning. It won't be over with the 2002 four-year cycle bottom, and based on the relationships of the bull and bear markets of the past, we are not likely to see the bottom of this bear market before 2008, possibly as late as 2010. The year 2008 is a strong possibility for the end of the bear market, because that would be roughly 33% of the duration of the preceding bull market. A bottom in 2010 would be closer to the 37.5% decline seen with the first bear market. From a cyclical perspective, this bear market will have to end with a four-year cycle low. We should expect the bottom with either the 2006 four-year cycle low or, more likely, the 2010 four-year cycle low.
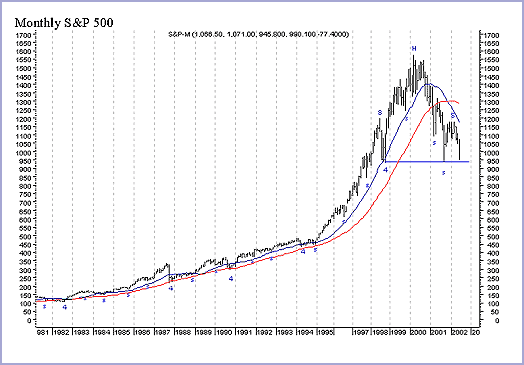
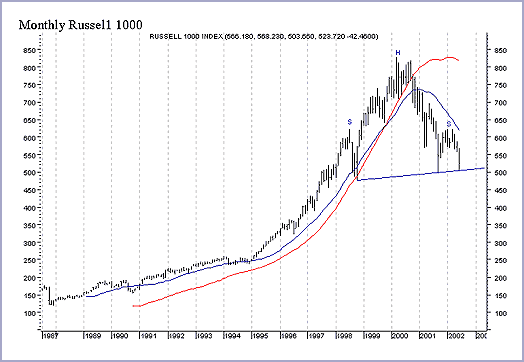
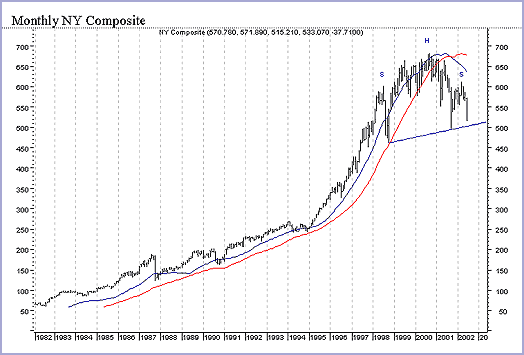
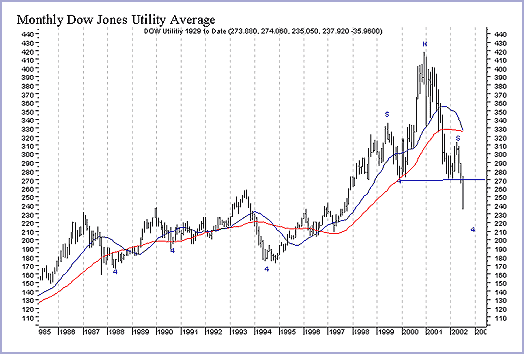
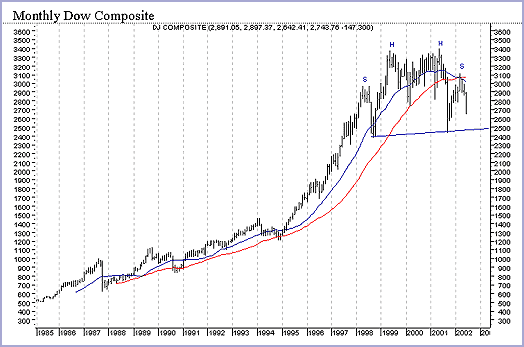
HOW FAR DOWN DO WE GO?My price objectives for the bear market are based on a simple method, one overlooked by most analysts: I looked at the monthly charts on the major averages. The S&P 500, Russell 1000, NY Composite, Wilshire 5000, Dow Jones Utility Average, and the Dow Jones Composite have all carved out huge head and shoulders formations. These formations begin with the 1998 four-year cycle low. (See Figures 1-5.) Based on the minimum measured moves for head and shoulders formations, my downside objectives for these averages are: Russell 1000 at 166, NY Composite at 305, Wilshire 5000 at 3006, Dow Jones Utility Average at 122, and the S&P at 314. Since the DJIA has not formed the same head and shoulders pattern, I cannot make the same downside objectives for it. However, if these head and shoulders patterns meet their minimum downside projections for this pattern, we could see the DJIA in the 3,000 range.
Figure 1: Monthly S&P 500.
Figure 2: Monthly Russell 1000.
Figure 3:Monthly NY Composite.
Figure 4: Monthly Dow Jones Utility Average.
Figure 5: Monthly Dow Jones Composite.
Another way of looking at the bear market price objectives would be to turn to the past. Unfortunately, there are only two examples to consider; the first one is the percentage decline from the 1929 bull market top to the 1932 bear market bottom. The bear corrected 108% of the bull market advance, taking the DJIA below where it had been when the bull market began. That scenario is not likely this time. The second example is the decline from the 1966 top to the 1974 bottom. This time, the bear only reclaimed 47% of the bull market advance on DJIA. Assuming a modest 47% decline of the 1974 to 2000 bull market, you can expect the S&P 500 at around 864 and the DJIA at around 6,495. Judging by the research I presented last November on the four-year cycle, the average decline for four-year cycles that have moved below the previous four-year cycle lows is 46%. This would put the DJIA at 6,330 and the S&P 500 at 829. However, I lean toward the objectives given by the minimum measured moves for the head and shoulders formations described previously. I say this because we are currently very close to meeting the higher objectives given above. It appears that these higher objectives will be met on the second leg of this bear market decline. Considering that the bear market should last another four to eight years, I am looking at the 3,000 range as the objective for the third and final bear market leg.
WHAT TO EXPECT IN THE MEANTIMENow that I've told you my long-term expectations, let's talk about the current four-year cycle and what you can expect after it bottoms. Once the current four-year cycle bottom is in place, I expect a move back to test the necklines on the monthly averages. I expect this rally to be powerful enough to make market participants excited about the markets again. The analysts will tell us that we have seen capitulation and the bear market is over. I fully expect them to talk about the new bull market that is under way. Don't buy it! These same analysts didn't see the end to the 19742000 bull market, nor the beginning of the current bear market. These analysts have also continuously denied we are in a bear market, insisting that the recession is over. From a Dow theory perspective, the rally out of the coming four-year cycle low will be nothing more than a major secondary reaction. From a cyclical perspective, I look for this to be another four-year cycle rally that should last fewer than 20 months. Then we should move below the 2002 four-year cycle lows as the bear market continues to move down into the 2006 four-year cycle low.
SUMMARYThere's no question we are in a primary bear market, nor that it is just beginning. It is not likely to conclude until at least 2006, more probably 2010. The DJIA should move down to at least the 6,495 level, and could even move deep into the 3,000 range. Don't fall for the hype from the Wall Street "analysts." They do not present factual evidence for their forecasts, which seem to be based on nothing more than hope and hype. Some of those analysts may even say that seeing bearish articles like this one should be taken as a sign that the bear market is over. Keep in mind I have been painting this bearish picture since mid-2001. I have tried to present factual evidence that we are in for something more than just a little correction. I have given a time frame based on history of when to expect the bottom. I have also given some idea, a range, of the potential for the downside of this primary bear market. As Richard Russell said, "In bear markets, the one that loses the least is the winner." I hope I can help more investors be winners.
Tim Wood can be e-mailed at cyclesman@jam.rr.com.
SUGGESTED READINGHamilton, William Peter [1998]. The Stock Market Barometer, reprint edition (originally published 1922), John Wiley & Sons.Rhea, Robert [1994]. The Dow Theory, reprint edition (originally published 1932), Fraser Publishing Co. Schaefer, E. George [1960]. How I Helped More Than 10,000 Investors To Profit In Stocks, Prentice Hall. Wood, Tim [2001]. "What Can Market Cycles Tell Us?" Technical Analysis of Stocks & Commodities, Volume 19: November. MetaStock (Equis International)
Current and past articles from Working Money, The Investors' Magazine, can be found at Working-Money.com.
|
PRINT THIS ARTICLE

Request Information From Our Sponsors
- StockCharts.com, Inc.
- Candle Patterns
- Candlestick Charting Explained
- Intermarket Technical Analysis
- John Murphy on Chart Analysis
- John Murphy's Chart Pattern Recognition
- John Murphy's Market Message
- MurphyExplainsMarketAnalysis-Intermarket Analysis
- MurphyExplainsMarketAnalysis-Visual Analysis
- StockCharts.com
- Technical Analysis of the Financial Markets
- The Visual Investor
- VectorVest, Inc.
- Executive Premier Workshop
- One-Day Options Course
- OptionsPro
- Retirement Income Workshop
- Sure-Fire Trading Systems (VectorVest, Inc.)
- Trading as a Business Workshop
- VectorVest 7 EOD
- VectorVest 7 RealTime/IntraDay
- VectorVest AutoTester
- VectorVest Educational Services
- VectorVest OnLine
- VectorVest Options Analyzer
- VectorVest ProGraphics v6.0
- VectorVest ProTrader 7
- VectorVest RealTime Derby Tool
- VectorVest Simulator
- VectorVest Variator
- VectorVest Watchdog

