HOT TOPICS LIST
- Strategies
- Stocks
- Buy
- Investing
- Brokers
- Psychology
- Interviews
- Accumulate
- Sell
- Hold
- Spotlight
- Websites
- Candlestick Corner
- Gold & Metals
- Options Trading
LIST OF TOPICS
TRADER'S NOTEBOOK
Even In A Bear Market, Opportunity Abounds
08/13/02 04:08:20 PM PSTby Austin Passamonte
Think it's difficult to make money in a bear market? Turn that frown upside down -- use the dips like rallies with put options.
| Despite the unsteady situation of the market right now, part-time traders have ample opportunity for impressive gains. That's even though you hear about equity traders expressing frustration every day over their difficulty finding success in recent financial markets. We could conclude that these traders are forcing tactics from the late 1990s' bull-run era onto today's entrenched bear market stocks trend. Since I purchased my first stocks in October 1987, market conditions have changed drastically. The sleepy early 1990s turned into the history-making bull-run acceleration through the latter part of the decade. These days, we have a different trend to trade, quite possibly one that will linger and endure for months and even years to come. Highly tradable opportunities still abound — just not in the direction that most recent arrivals to the game expect.
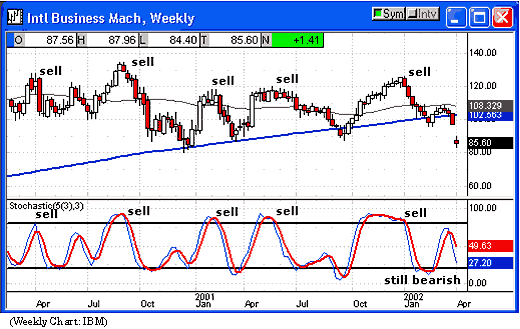
BASIC TOOLS FOR SUCCESSThere are more proprietary indicators, systems, and methods at work in the markets today than ever before. Many if not most of those probably work fine, but the average trader can get by and even thrive on simple, basic technical studies that have already been in use for decades. I clearly recall the last time IBM broke above $120, back in December 2001. I wrote then that IBM would see $85 again before $150, but that market call certainly required no clairvoyance. The fact was, IBM was grossly overbought at $120 on both weekly and daily charts as measured by stochastic values. You could have reached (and perhaps did reach) the same conclusion: IBM, though a fine company, had a terrible risk/reward stock at $120+ per share. (See Figure 1.) Countless traders scoffed at such studies, went long at these lofty levels, and got crushed by the weight of this 800-pound gorilla shedding 200 of those pounds in a freefall.
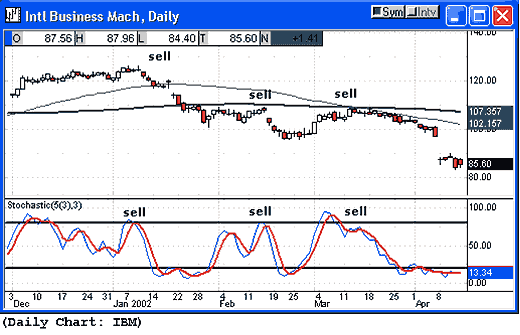
Figure 1: The stochastic oscillator shows several sell signals on the weekly chart of IBM. Think the weekly chart of IBM was a lucky guess? The same chart template, condensed to a daily chart view, can be seen in Figure 2. Note where three clear warning signs to sell appeared as stochastic values began to reverse lower from the overbought extreme. These are areas where no upside buying, only defensive moves, should have been taking place. In each case, price action either broke below or remained below the 50- and 200-period moving averages as further confirmation of weakness.
Figure 2: The daily chart shows a scenario similar to the weekly chart.
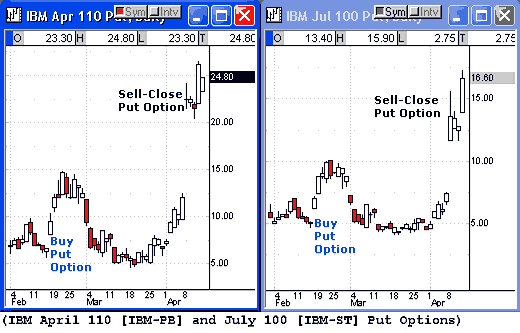
What if you'd bought some April, May, or June IBM 110 or 100 put options on the last bearish stochastic alignment near the middle of February? Might that have been a favorable risk/reward setup, based on repeated historical patterns? Put options give a buyer the right (but not the obligation) to control 100 shares of the underlying symbol at any point from purchase into the future until the contract's expiration. When weekly and daily charts of IBM were flashing sell signals (Figure 3) via overbought stochastics, April IBM 110 put option contracts were selling for $700 to $1,000 each. Traders who believed IBM might have had greater downside risk but wanted more time until expiration could have opted for July 100 put option contracts, selling for $500 to $750 instead. These charts were captured two months later when IBM broke down to confirm the dual-chart study, and both put options appreciated measurably along the way.
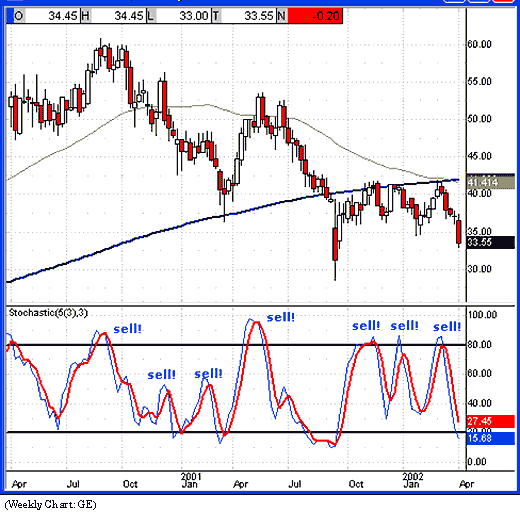
Figure 3: The use of put options would have resulted in profitable trading opportunities. How's that for decent buy and hold gains via part-time trading efforts? Maybe it was just an anomaly, a low-odds hit at random. Perhaps this method was just too simple and doesn't work on most other examples? Even the largest corporation in the world today is not exempt from the universal market laws of overbought and oversold extremes. General Electric (GE) weekly and daily charts (Figure 4) have flashed — make that screamed — seven clear sell signals from August 2000 until the present. But guess what the public was steered toward doing each time? That's right: media reports gushed over the fundamentals of GE's corporate strength, pointing to new recent highs as evidence. But a company can be fundamentally sound while its stock is less than attractive (or safe), regardless of the market's perception of fair value.
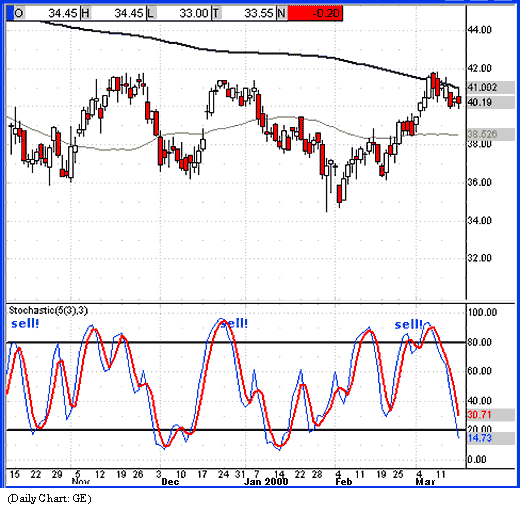
Figure 4: The weekly chart of General Electric (GE) is not much different from that of IBM. It's as natural as the sunrise for market sentiment to be bullish in overbought extremes and bearish in oversold extremes, but you must reverse this emotional condition in order to prosper. Every time GE was praised in the media the unsuspecting public bought the extended market. Each time it marked a near-term top and fell straightaway with momentum players aboard. The daily chart of GE displayed in Figure 5 shows the last three sell signals listed from the latter part of 2001. If you had merely exited longs up there or better yet, invested in distant-month put options to ride down toward oversold extremes, what would account balances look like now? Pretty good! GE was a strong sell at $42 in early March, and April to June puts worked out quite well for buy and hold traders. How well? Take a look at the charts displayed in Figure 6.
Figure 5: The stochastic oscillator applied to the daily chart of GE generates a few sell signals you can take advantage of to generate profits.
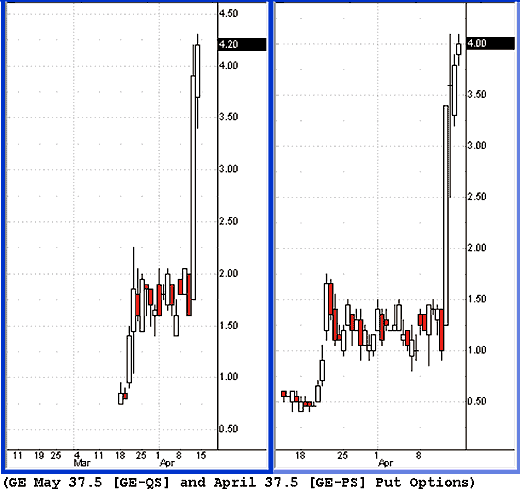
Figure 6: The results of buying May 37.5 and April 37.5 put options can be seen here.
It looks like part-time buy and hold options traders could have played GE to the downside with May 37.5 puts at 1.00 or April 37.5 puts at 0.50 on or near February 18 — plenty of time to spot this setup. Assume you use $1,500 to invest. You could have played 10 April put option contracts for $500 total and 10 May put option contracts for $1,000 total. Stops could be -50% of purchase, or perhaps you might decide the entire $1,500 would be your risk on this trade. That would be akin to selling 1,000 shares of GE stock short and setting a stop-loss order 1.50 points above the entry on a swing trade to control loss. However, risking -$1,500 on total option purchase limits potential drawdown to that amount and not one penny more. A stop-loss order for 1.50 per share could easily be exceeded on a gap-open move higher in the shares against your trade, so the risk is much greater. This example applies equally to long and short plays of a stock held open over the close. What happened next? At present, the 10 April put option contracts would yield $4,000 and the 10 May contracts would yield $4,200 for a total of $8,200 on the $1,500 originally risked. Simple calculations suggest that would be a 446% gain on capital. Sometimes swing trading really is as plain as that.
MASSIVE OPPORTUNITY STILL EXISTSIt's not uncommon to hear traders grumbling about how few good trades are available, about how badly the markets are going, and so on. Bull market dinosaurs may be touting that idea, but I don't accept it and neither should you. Southbound rallies like the two I've described take place every week. Opportunity abounds for part-time traders. All you need to do is use simple chart combinations, play puts in overbought extremes, and play calls in oversold extremes when the reversal move begins. Determine your level of risk and diversify across a few different symbols. Pretend these are the go-go years of 1998 and 1999 and buy puts on every failed rally. Keep doing that whenever weekly and daily chart signals go overbought in unison until the bear market ends, which could be months or years from now. Regardless, equity traders can easily play either direction with equal opportunity for profit. This is the key advantage you hold over the general investing crowd.
Austin Passamonte has followed and traded futures, stocks, and equity options markets since 1984. Currently, he is the founder and editor of CoiledMarkets.com, a trader's advisory and educational website service. He may be reached at austinp@coiledmarkets.com. Charts & data courtesy of QCharts by Quote.com.
Current and past articles from Working Money, The Investors' Magazine, can be found at Working-Money.com.
|
Austin Passamonte is a full-time professional trader who specializes in emini stock index futures, forex, and commodity markets. His trading approach uses proprietary chart patterns found on an intraday basis. To find out more about Passamonte's work, visit www.coiledmarkets.com.
| Website: | www.CoiledMarkets.com |
| E-mail address: | austinp@coiledmarkets.com |
PRINT THIS ARTICLE

Request Information From Our Sponsors
- StockCharts.com, Inc.
- Candle Patterns
- Candlestick Charting Explained
- Intermarket Technical Analysis
- John Murphy on Chart Analysis
- John Murphy's Chart Pattern Recognition
- John Murphy's Market Message
- MurphyExplainsMarketAnalysis-Intermarket Analysis
- MurphyExplainsMarketAnalysis-Visual Analysis
- StockCharts.com
- Technical Analysis of the Financial Markets
- The Visual Investor
- VectorVest, Inc.
- Executive Premier Workshop
- One-Day Options Course
- OptionsPro
- Retirement Income Workshop
- Sure-Fire Trading Systems (VectorVest, Inc.)
- Trading as a Business Workshop
- VectorVest 7 EOD
- VectorVest 7 RealTime/IntraDay
- VectorVest AutoTester
- VectorVest Educational Services
- VectorVest OnLine
- VectorVest Options Analyzer
- VectorVest ProGraphics v6.0
- VectorVest ProTrader 7
- VectorVest RealTime Derby Tool
- VectorVest Simulator
- VectorVest Variator
- VectorVest Watchdog

