HOT TOPICS LIST
- Strategies
- Stocks
- Buy
- Investing
- Brokers
- Psychology
- Interviews
- Accumulate
- Sell
- Hold
- Spotlight
- Websites
- Candlestick Corner
- Gold & Metals
- Options Trading
LIST OF TOPICS
CANDLESTICK CORNER
Connors' Undeniables And Candlestick Clarity
08/20/02 03:50:52 PM PSTby David Penn
Adding candlesticks and exchange-traded funds to Connors' Undeniables six-week reversal strategy makes trades both more rewarding and easier to spot.
| In the same way our children will wonder how any of us got any writing done before the age of word-processing computers, I've begun to wonder how traders got any confident trading done before Japanese candlesticks. While there is plenty to be gained from simple bar and even line charts — particularly when looking at smaller charts of longer time frames — the ability of Japanese candlesticks to provide such a wide range of information in an exceptionally easy-to-read format is a breakthrough for Western technical traders that is every bit as significant as the discovery of moving averages and support and resistance. To me, what is most compelling about candlesticks is not necessarily the evening stars and hanging man formations, or the three white soldiers marching off against the three black crows — even though I have a great deal of respect for those who are able to trade successfully using the standard candlestick interpretations of price action. No, what I love about Japanese candlesticks is how they can turn an ordinary bar or line chart into a veritable fountain of trading information that can be used in other contexts, be they tests against oscillators, momentum indicators, chart formations such as head and shoulders or ascending triangles, or even simple six-week reversals of the kind found in Larry Connors' index option trading strategy, a strategy he calls Undeniables. Connors' Undeniables strategy is found in the book he cowrote with Blake Hayward, Investment Secrets Of A Hedge Fund Manager. Like Street Smarts, the text Connors wrote with Linda Bradford Raschke, Investment Secrets is a collection of favorite setups for trades in stocks, futures, index options, and other tradables. I had been reading and studying Connors' Undeniables strategy for months, but it was not until I began using Japanese candlesticks in this capacity that I finally came to see what was so effective about the Undeniables approach.
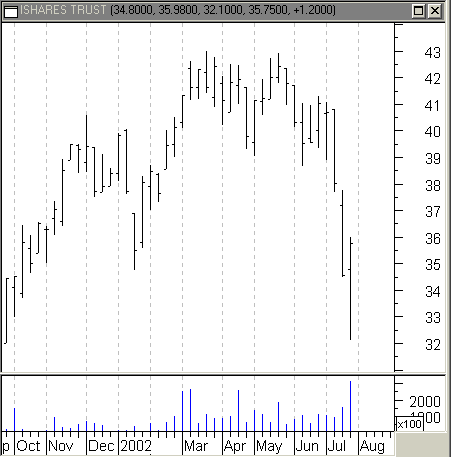
UNDENIABLE HIGHS AND LOWSAlthough Larry Connors asserts that his Undeniables strategy is one he has used most effectively with index options (and with selling index options, at that), this discussion will use sector iShares outrights instead. There are several reasons for this. First, I personally have felt uncomfortable selling options, given my own low level of experience with options and relatively small trading capital. In addition, many of the indexes and their options that Connors refers to either have been restructured or are no longer widely traded. Finally, the rise of exchange-traded funds such as the sector iShares provides a trading vehicle that was not available when Connors wrote his book in 1995. Essentially, the Undeniables approach calls for buying bullish six-week lows and selling bearish six-week highs. What makes a weekly low bullish and a weekly high bearish? As far as Connors' Undeniables are concerned, a weekly low that closes above its open is considered bullish, whereas a weekly high that closes below its open is considered bearish. In the model, when an intraweek price makes a new six-week low, yet the week finishes up (close above open), the trader would look to buy that market the following week as soon as it trades above last week's "bullish" close by some fraction of a point. Conversely, when an intraweek price makes a new six-week high, yet the week as a whole finishes down (close below open), then the trader would look to sell that market the following week as soon as it trades below last week's "bearish" close by some small amount. On a weekly bar chart (Figure 1), these reversal bars can be difficult to read, particularly on those charts that have ridiculously small OHLC cross bars. Unfortunately for me, my copy of Investment Secrets Of A Hedge Fund Manager features just that sort of skinny bar, from which the OHLC points were always a chore to read. Compare the difference, however, when looking for these same characteristics when the bars are swapped out for candlesticks.
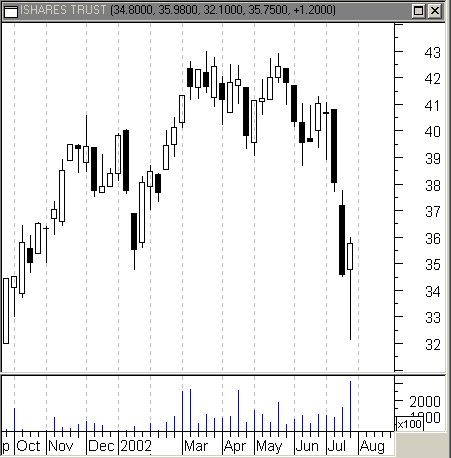
Figure 1: Weekly bar chart of iShares basic materials sector (IYM). Weekly bar charts are clean, but often difficult to read precisely, as this chart of the basic materials iShare shows. The candlestick chart version of the same period is displayed in Figure 2. In addition to being more colorful, the candlestick chart also provides a great deal more clarity to the six-week low IYM (the iShare for the basic materials sector) reached during the week of July 22. More important, the candlestick chart makes it easier to recognize the bullishness of the six-week low in IYM compared to the same low in the bar chart at the top. With this candlestick in particular, there is also bullish information provided by the long lower tail. Again, all the information that is in the bar chart at the top is in the candlestick chart. The difference is that the candlestick chart provides information at a glance, where the bar chart requires at least some scrutiny.
Figure 2: Weekly candlestick chart of basic materials iShares (IYM). This chart is much more informative than a bar or line chart version.
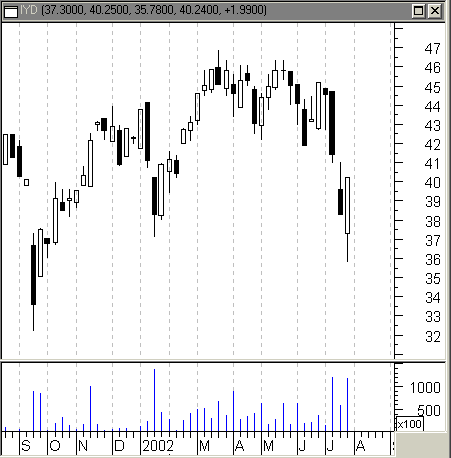
GAMING THE REVERSALSThe simplicity of Connors' Undeniables strategy for trading index options goes well with the interpretive simplicity of Japanese candlesticks. Connors notes that the Undeniables strategy is good not only for noting reversal patterns, but also, "it does an even better job of identifying momentum coming out of a move." This is important, because the positions taken on the basis of weekly charts — the moves that ensue from six-week highs and lows — can be sizable indeed. An example of a six-week high reversal using the chemicals sector iShare, IYD, can be seen in Figure 3. The chemicals sector starts off 2002 with a strong advance, but tops out in March. The first signal that a top was forming was a sell signal from the Undeniables strategy that came with the (red) reversal candlestick with the long top shadow on the week of March 22. It is this shadow that makes the six-week top, and it is the close beneath the open that provides the "sell" signal in this context. Selling IYD the following week at 44.86, IYD fell to 42.96 by April 26 and 41.83 by June 14. At its bearish worst, IYD traded as low as 38.25 in mid-July.
Figure 3: Chemicals iShare (IYD). Here you see a six-week bearish high in IYD in March and a six-week bullish low in July.
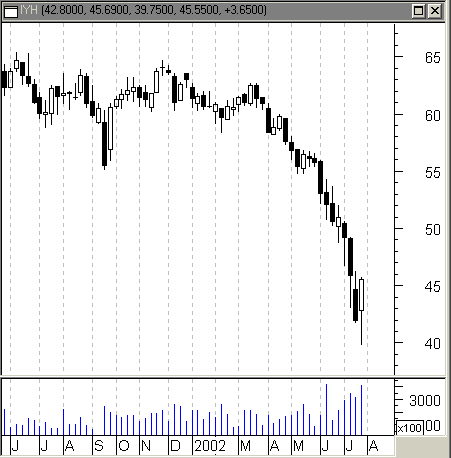
Another example of a six-week high reversal comes in the health-care sector in the autumn of 2001 (Figure 4). Note the six-week high at the end of November, which comes in the form of a narrow-range bar (NRB). This bearish six-week high at the end of November is all that a trader using the Undeniables strategy would need to set up a short position in IYH for the following week. Assuming a fill of around 63.5 and a 5% stop-loss, this position would have been a winner off the bat, particularly as IYH broke down the following spring.
Figure 4: Healthcare iShare (IYH) Here you see a six-week bearish high in IYH in November 2001 and a six-week bullish low in July 2002.
It should, however, be obvious by now why Connors used options with this particular strategy. For those uncomfortable with holding positions for weeks, an Undeniables strategy using outrights could be maddening. In addition, the use of options provides the sort of leverage that makes these two-, three-, and four-point gains in the outrights truly worthwhile.
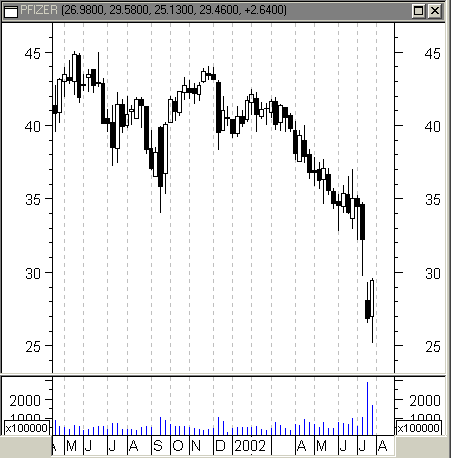
THE OPTIONS INSIDEOf course, another approach is to select stocks or options based on the constituents of the respective indexes. When an index makes a bullish six-week low, then look for the strongest or most representative stocks in that group for opportunities on the buy side. Conversely, when an index makes a bearish six-week high, then instead look for the weaker stocks in that index for possible short-selling opportunities. The idea is to exploit the higher volatility of constituent stocks. An example using the Healthcare iShare (IYH) is displayed in Figure 5. Note that IYH made a bearish six-week high in late November 2001. A short position in IYH could have been taken at about 64 at the end of the month. Six weeks later, IYH closed at 61.55 for a mediocre 3.8% gain. IYH fell into a trading range with support at 60, and did not finally break down until April, when it first closed below 60. However, consider if instead of taking a short position in the IYH iShare, a trader took a short position in one of the larger constituent stocks such as Pfizer or Johnson & Johnson. Pfizer made a bearish six-week high on the weekly chart at the same time as the IYH. A short position the following week could have been entered at about 43.5. Six weeks later, Pfizer was at 40.6 — a 6.6% gain. Had a trader taken the short position with Pfizer puts, the additional leverage would have produced an even greater gain.
Figure 5: Undeniables at work. Trading the constituent stock — or even better options on that stock — of a given iShare can be an even more profitable way to take advantage of these six-week reversals.
Pfizer provides us with an opportunity to show just how using options can help those using this bullish six-week low, bearish six-week high Undeniables strategy. IYH made a bullish six-week low on the week ended July 26. Not coincidentally, so did Pfizer, which closed at 29.46. The September 30 calls for Pfizer were selling at 1.55 as of July 26. By the following Tuesday, the September 30s were at 2.40, a gain of almost 55%. Should Pfizer reverse from current levels, a sizable amount of this gain would be captured by even the most rudimentary money management. Price Headley, for example, in his Big Trends In Trading, recommends that options traders move stops to break even on a gain of 25% or more, and that they consider selling half the position on a 100% gain or more, turning the remaining "half" position into what Headley calls "no-risk trades."
TRADING WITH THE MARKETConnors' Undeniables strategy, when combined with Japanese candlesticks, makes for an excellent intermediate time frame trading/investing approach. Because of the momentum from six-week bullish lows and six-week bearish highs, the strategy succeeds by counting on some significant follow-through in the succeeding weeks. When the strategy is at its best, traders are able to capture the lion's share of sizable moves off of major lows and highs. There are some important additions that can make the basic strategy all the more rewarding. Trading constituent stocks, for example, allows the trader to take advantage of high volatility in the stock (compared to the index or iShare) to reach for greater gains. Still greater gains, as has been shown, can be achieved by the straightforward if not simple approach of buying options with strike prices near the highs of six-week bullish lows and near the lows of six-week bearish highs. Both in-the-money and out-of-the-money options can, because of the time frame involved, be profitable vehicles for this kind of option trading. Many of the best and most successful traders insist that simple methods, be they moving averages, support and resistance, or Japanese candlesticks, are all a trader needs to be successful in the markets. Here, we find that sometimes combining simple strategies — such as Connors' Undeniables, Japanese candlesticks, and simple buying and selling of options — can be the among the most rewarding strategies for investors and traders of all levels.
David Penn may be reached at DPenn@Traders.com.
SUGGESTED READINGConnors, Laurence A., and Blake E. Hayward [1995]. Investment Secrets Of A Hedge Fund Manager, Probus Publishing Company.Connors, Laurence A., and Linda Bradford Raschke [1995]. Street Smarts: High Probability Short Term Trading Strategies, M. Gordon Publishing Group. Headley, Price [2002]. Big Trends In Trading, John Wiley & Sons. Nison, Steve [1991]. Japanese Candlestick Charting Techniques, New York Institute of Finance. __________ [1994]. Beyond Candlesticks, John Wiley & Sons. Charts courtesy of MetaStock (Equis International)
Current and past articles from Working Money, The Investors' Magazine, can be found at Working-Money.com.
|
Technical Writer for Technical Analysis of STOCKS & COMMODITIES magazine, Working-Money.com, and Traders.com Advantage.
| Title: | Traders.com Technical Writer |
| Company: | Technical Analysis, Inc. |
| Address: | 4757 California Avenue SW |
| Seattle, WA 98116 | |
| Phone # for sales: | 206 938 0570 |
| Fax: | 206 938 1307 |
| Website: | www.traders.com |
| E-mail address: | DPenn@traders.com |
Traders' Resource Links | |
| Charting the Stock Market: The Wyckoff Method -- Books | |
| Working-Money.com -- Online Trading Services | |
| Traders.com Advantage -- Online Trading Services | |
| Technical Analysis of Stocks & Commodities -- Publications and Newsletters | |
| Working Money, at Working-Money.com -- Publications and Newsletters | |
| Traders.com Advantage -- Publications and Newsletters | |
| Professional Traders Starter Kit -- Software | |
PRINT THIS ARTICLE

|

Request Information From Our Sponsors
- StockCharts.com, Inc.
- Candle Patterns
- Candlestick Charting Explained
- Intermarket Technical Analysis
- John Murphy on Chart Analysis
- John Murphy's Chart Pattern Recognition
- John Murphy's Market Message
- MurphyExplainsMarketAnalysis-Intermarket Analysis
- MurphyExplainsMarketAnalysis-Visual Analysis
- StockCharts.com
- Technical Analysis of the Financial Markets
- The Visual Investor
- VectorVest, Inc.
- Executive Premier Workshop
- One-Day Options Course
- OptionsPro
- Retirement Income Workshop
- Sure-Fire Trading Systems (VectorVest, Inc.)
- Trading as a Business Workshop
- VectorVest 7 EOD
- VectorVest 7 RealTime/IntraDay
- VectorVest AutoTester
- VectorVest Educational Services
- VectorVest OnLine
- VectorVest Options Analyzer
- VectorVest ProGraphics v6.0
- VectorVest ProTrader 7
- VectorVest RealTime Derby Tool
- VectorVest Simulator
- VectorVest Variator
- VectorVest Watchdog

