HOT TOPICS LIST
- Strategies
- Stocks
- Buy
- Investing
- Brokers
- Psychology
- Interviews
- Accumulate
- Sell
- Hold
- Spotlight
- Websites
- Candlestick Corner
- Gold & Metals
- Options Trading
LIST OF TOPICS
FOCUS ON
Market Bubbles
08/27/02 11:47:40 AM PSTby David Penn
By now, few can deny the existence of a bubble bursting in the US equities market. But few agree on what comes next.
| Conventional wisdom suggests that investors never recognize a market bubble until it bursts. Of course, this conventional wisdom itself tends never to be uttered until after a previously soaring market starts to falter, making this "wisdom" more a post-hoc palliative than anything else. Every time a market "goes parabolic," with prices moving up at times in virtually straight lines, there are any number of astute observers who caution that things are getting out of hand, that investors are suffering from "irrational exuberance," that "speculation is rampant," that "valuations have reached historically high levels." Yet each time, the band plays on. The only thing more amazing than the destructive power of a market bubble bursting is the inability of so many investors to perceive the growing risk/reward premium they pay for their skyrocketing assets. But then, while the dance floor is full, who cares what happens in the morning? Alan Greenspan uttered his infamous "irrational exuberance" comment in December 1996. Weekly cumulative breadth for the Nasdaq and NYSE topped out in 1997. Cumulative highs and lows for the Nasdaq topped out in 1998. But because of the "leadership" of the technology and telecommunications stocks of the Nasdaq, what came to be referred to as "the market" continued to rise until the spring of 2000, fully three years after Greenspan first began warning that the stock market was overvalued.
TIMING THE BUBBLEThese two factors help explain some of the mystery of market bubbles. Between the fact that timing the exact moment when a bubble will burst is extremely difficult, on the one hand, and the reality that few people ever really want that bubble to burst, on the other, there is a great deal of time for the bubble to get much too big. Every day that the bubble does not burst only gives investors — particularly those arriving later — more reason to believe (or want to believe) that the bubble will continue to expand. Veteran money managers begin to doubt their years of learning and experience as it increasingly appears that anyone can make money in the market. Contests begin to appear in the business sections of newspapers challenging local money managers to stock-picking duels with average readers or worse, with darts thrown against a list of actively traded local stocks tacked to the wall. Just as denial reigns when market bubbles begin, there is an equal amount of denial when bubbles burst. When the party does eventually end, too many revelers refuse to believe it. Imagine drunken celebrants hoarsely crooning "Fly Me to the Moon" after the Frank Sinatra's Greatest Hits CD has long since been returned to the jewel box and the hosts have begun the arduous task of cleaning up the mess. That is often how too many investors have found themselves: as the party wound down, they were asking for another round of drinks when they should have been calling for taxicabs. Here we will look at two burst bubbles: the Japanese bubble in 1990 and the US equities bubble of 1929. Whether or not market bubbles can be anticipated, there is likely some merit in analyzing the history of market behavior in the wake of other market bubbles. How long do the big bubble bursts last? How far down do the markets go? In this, past performance is our only guide to the possibilities of future (under)performance. TURNING JAPANESE? There are any number of differences between the growth of the Nikkei 225 in the 1980s and the growth of the Nasdaq (and, by extension, the entire US equities market) in the 1990s. Those commentators currently seeking to calm nervous investors in US equities, in fact, have been doing overtime to accentuate the dissimilarities. Richard Katz, writing in London's Financial Times, insists that among other differences:
·The US stock bubble was technology-oriented; in Japan, the entire stock market was part of the bubble.
·There was no land asset inflation in the US comparable to the vertigo-inducing real estate prices of late-1980s Japan.
·"In the US," asserts Katz, "there is no debt crisis on the horizon." By comparison, he says, "Japan's asset bubble also triggered an excess of physical investment financed by now-unpayable bank debt."
Katz, like others, presents additional differences. But the underlying point is that there is little to be gained by a comparison of the collapse of the Japanese stock market (and subsequent deflationary implosion of the Japanese economy) with the currently collapsing US stock markets. There are those, of course, who disagree with the sort of claims Katz makes. Many of these critics point to the widespread nature of accounting scandals and stock option-related earnings fraud in the US, suggesting that American banks are much less pristine relative to their Japanese counterparts than people like Katz would admit. The strength of the housing market in the United States, save for isolated pockets, has come under fire from some who believe that artificially low interest rates (another aspect of a deflationary environment) are encouraging poorly reasoned investment and speculation in real estate, which is keeping housing prices unnaturally high. And people like Katz are far more sanguine on the issue of American debt than many others. As The Economist noted in a special report in February 2002:
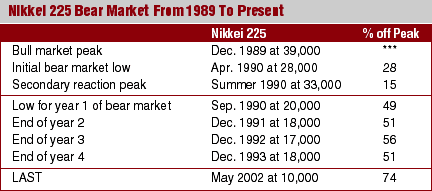
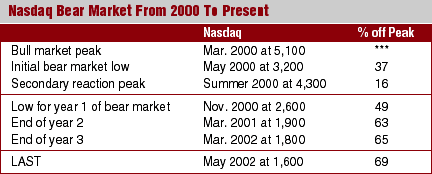
The combination of low inflation, money illusion, and aggressive interest-rate cuts by the Fed explains why, unlike in previous downturns, the debts of American households have continued to expand briskly in real terms. Following a massive increase in debt during the boom, the Fed's interest-rate cuts are now encouraging companies and consumers to borrow even more to prop up spending. In the short term, this has made the recession shallower, but problems may still lie ahead. Whatever differences between the Japanese bubble and the US bubble do or do not exist, these differences are nowhere less apparent than in the behavior of the Nikkei 225 and the Nasdaq. In fact, the correlation between the bursting of the Nikkei 225 bubble between 1990 and 1991 and the bursting of the Nasdaq bubble between 2000 and 2001 is alarming, as Figures 1 and 2 reveal.
Figure 1: Nikkei 225 bear market from 1989 to present.
Figure 2: Nasdaq bear market from 2000 to present.
Note first how the price action in the Nikkei 225 during the first year of its bear market correlates with the Nasdaq since its March 2000 top. I use Dow theory's system of primary swings and secondary reactions to market the major moves in both indexes, though I suspect a Fibonacci-oriented chartist would find these levels matching up well with his retracement levels. What is especially interesting about comparing the Nasdaq in 2000 with the Nikkei 225 in 1990 is that both markets grew from bullish markets to bubble markets by way of easy monetary policies that kept interest rates artificially low for too long and made credit exceptionally available, making bad investments appear almost as worthwhile as good ones. The direct beneficiaries of easy money policies in Japan were banks, while the direct beneficiaries of easy money policies in the US were heavily leveraged corporations in technology, particularly telecommunications industries. But the hazards are nearly identical. As economist Jeffrey Herbener noted back in 1995:
The boom-bust cycle is set in motion when the central bank inflates the money supply through the credit markets. Banks lend beyond the sum available from private savings, while central bank policy artificially pushes the rate of interest below its market level. Enticed by the lower rate, entrepreneurs borrow additional money to make capital improvements and expansions. Consumers borrow more to purchase durable goods, houses, and cars . . . The likening of the Nikkei and Nasdaq bubbles here is not intended to suggest that the Nasdaq will suffer a Nikkei-like 12-year secular bear market. As numerous commentators have observed, the US economy is far more flexible — in terms of labor and capital — than the Japanese economy. Even more important, the US has the Japanese example to learn from — but that's assuming US economists have not already convinced themselves of how "different" the American bubble is.
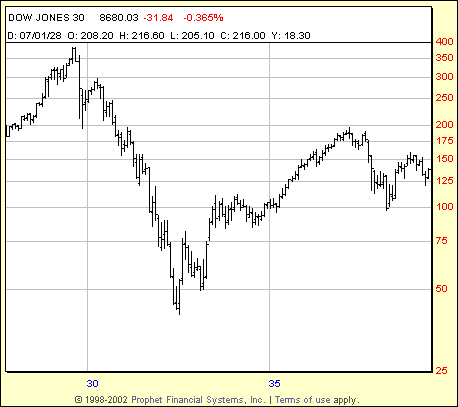
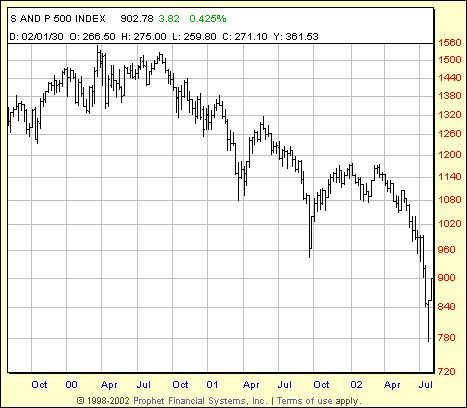
DEPRESSION 2000Do an equities bubble and a deflationary economy in the 21st century still spell "Depression"? In the beginning of the current bear market, commentators likened the stock market's weakness to the short recession of 199091. As the market continued to deteriorate, those inclined to make comparisons retreated to Black Monday, the crash of 1987, when the Dow Jones Industrial Average (DJIA) lost 39.8% in one month. Unfortunately, the secular bear market that began in the spring of 2000 would not be satisfied with even that comparison. So market watchers retreated further to the vicious bear market of 197374, when the DJIA lost 46.5% in two years. But none of these other market crashes truly compares to the devastation that equity investors have seen in recent years. The 199091 was more about an economic recession than a stock market bubble, and the crash of 1987, severe as it was, was essentially a five-day event. The bear market of 197374 is far more comparable (the Standard & Poor's 500 lost 47% then, compared with a loss of 50% from March 2000 through July 2002). But the problem with the 197374 bear market is that, as is abundantly clear in hindsight, this was the final decline of a secular bear market that began in 1966. If anything, the declines of 200002 are taking place at the beginning, not the end, of a secular bear market trend in equities. These are among the reasons why the crash of 1929 and the subsequent Great Depression are increasingly a more worthwhile slice of market history with which to compare the market's current crises. Unfortunately, there is another strong similarity between the crash of 1929 and the crash of 2000: the return of deflation to the economies in question. Deflation, which often begins as a productivity-enhancing disinflation that works excess money from the economy, is a rare and difficult monetary phenomenon for economists to undo (Japan has been suffering through deflation for over a decade). While some of deflation's most obvious effects — falling prices and increased productivity — are initially quite attractive to consumers, the crunch on profits and the ability of companies to issue debt (in deflation, the value of money is increasing, making debt riskier because of the likelihood of repaying those debts in money that has become more valuable over time) is a real problem for companies. These problems — in Japan in the 1990s and in the US in the 1930s — are typically reflected in stock prices that dramatically underperform relative to other historical periods, even inflationary ones. Figures 3 and 4 depict the crash of 1929 and its deflationary aftermath. Note that it took the Dow industrials until the middle of 1932 to reach bottom, about 33 months or two and a half years after the initial peak. Looking to the S&P 500, we see that after a peak in March 2000 (over two years ago), the S&P 500 is still falling (going into July 2002). The crash of 1929 remains more devastating in percentage loss terms than either the S&P 500's and Nasdaq's current crashes (the S&P 500 is about 50% of its all-time peak; the Nasdaq is 77%, compared to the crash of 192932's Dow industrials decline of about 88%).
Figure 3: Dow Jones Industrial Average. A look at the crash of 1929 and the bear market that followed.
Figure 4: S&P 500 index. In two years, the crash of the S&P 500 lost 50% of its value.
Of course, the question is: does the crash of 1929 suggest that there is still time for the contemporary indexes to lose more value? Or does the fact that the modern-day S&P 500 and Nasdaq have declined for 30 months without shedding more value count for more?
WHOSE HISTORY IS IT ANYWAY?Is the US equities bear market of 200002 a Japanese knockoff or a bit of nasty market nostalgia for the old Depression-era days? There is really no way to tell — even considering a likely third possibility that our contemporary S&P 500 will move in a way completely different from either the Japanese and the crash of 1929 examples. More important, comparing our current stock market woes with the market catastrophes of the past does help investors maintain some perspective as to what markets could or might do, thus granting investors with an opportunity to strategize about what they could or might do to protect their investment money and maybe even realize a few gains at the same time. As legendary trader Richard Dennis suggests in his Market Wizards interview with author Jack Schwager, it is important to be able to imagine scenarios that others feel are impossible, or could never happen: $800 gold, Nasdaq 5000, 40-year lows in interest rates. . . . Why? As history has shown, the biggest returns and the best trades are often made both on the way to these unbelievable extremes and on the way back.
David Penn may be reached at DPenn@Traders.com. RELATED READING Schwager, Jack D. [1989]. The Market Wizards, New York Institute of Finance/Simon & Schuster. ProphetFinance
Current and past articles from Working Money, The Investors' Magazine, can be found at Working-Money.com.
|
Technical Writer for Technical Analysis of STOCKS & COMMODITIES magazine, Working-Money.com, and Traders.com Advantage.
| Title: | Traders.com Technical Writer |
| Company: | Technical Analysis, Inc. |
| Address: | 4757 California Avenue SW |
| Seattle, WA 98116 | |
| Phone # for sales: | 206 938 0570 |
| Fax: | 206 938 1307 |
| Website: | www.traders.com |
| E-mail address: | DPenn@traders.com |
Traders' Resource Links | |
| Charting the Stock Market: The Wyckoff Method -- Books | |
| Working-Money.com -- Online Trading Services | |
| Traders.com Advantage -- Online Trading Services | |
| Technical Analysis of Stocks & Commodities -- Publications and Newsletters | |
| Working Money, at Working-Money.com -- Publications and Newsletters | |
| Traders.com Advantage -- Publications and Newsletters | |
| Professional Traders Starter Kit -- Software | |
PRINT THIS ARTICLE

Request Information From Our Sponsors
- StockCharts.com, Inc.
- Candle Patterns
- Candlestick Charting Explained
- Intermarket Technical Analysis
- John Murphy on Chart Analysis
- John Murphy's Chart Pattern Recognition
- John Murphy's Market Message
- MurphyExplainsMarketAnalysis-Intermarket Analysis
- MurphyExplainsMarketAnalysis-Visual Analysis
- StockCharts.com
- Technical Analysis of the Financial Markets
- The Visual Investor
- VectorVest, Inc.
- Executive Premier Workshop
- One-Day Options Course
- OptionsPro
- Retirement Income Workshop
- Sure-Fire Trading Systems (VectorVest, Inc.)
- Trading as a Business Workshop
- VectorVest 7 EOD
- VectorVest 7 RealTime/IntraDay
- VectorVest AutoTester
- VectorVest Educational Services
- VectorVest OnLine
- VectorVest Options Analyzer
- VectorVest ProGraphics v6.0
- VectorVest ProTrader 7
- VectorVest RealTime Derby Tool
- VectorVest Simulator
- VectorVest Variator
- VectorVest Watchdog


