HOT TOPICS LIST
- Strategies
- Stocks
- Buy
- Investing
- Brokers
- Psychology
- Interviews
- Accumulate
- Sell
- Hold
- Spotlight
- Websites
- Candlestick Corner
- Gold & Metals
- Options Trading
LIST OF TOPICS
TRADER'S NOTEBOOK
Is Fundamental Analysis Dead?
09/10/02 02:04:29 PM PSTby William Frantz
Maybe, in light of current market conditions.
| From Enron to WorldCom on, misleading accounting practices have crippled Wall Street, making investors leery of the markets. Many analysts agree that accounting fraud has been a major factor in propelling the market downward into the depths of one of the longest bear markets in history. In fact, corporate wrongdoing has had an even more devastating effect than the events of September 2001. Why? When savvy investors buy stock, they generally perform financial research on the company before making the purchase. A smart investor will research a stock before jumping in and spending hard-earned money. In this sense, stock is no different from any other purchased product. For example, before buying a car, consumers often read Consumer Reports magazine or Consumer Digest to see which vehicle is rated the best. Simply relying upon the word of the car salesman is not enough.
WHAT RESEARCH IS NECESSARY?In the world of finance, there are two general forms of research: technical analysis and fundamental analysis. Technical analysis is a method of evaluating stock by analyzing statistics generated by market activity, such as past prices and volume. Technical analysts do not attempt to measure a stock's intrinsic value. Often, technical analysts use charts and graphs of past price movements to predict future movements. Such technical analysts are often known as "chartists." On the other side of the coin is fundamental analysis. This consists of evaluating stock by attempting to measure intrinsic value. This value is based upon several factors, including the overall economy, industry conditions, and (most significantly) the financial condition and management of a particular company. This is where the problem lies. At the heart of fundamental analysis is the application of generally accepted accounting principles (GAAP). These principles regulate how a company reports earnings and describe several federally mandated reporting requirements that every publicly listed corporation is required to file with the Securities and Exchange Commission (SEC). When these principles are violated by false or fraudulent accounting practices, a fundamental analyst or investor cannot use the principles of fundamental analysis to accurately examine a particular stock's earning potential. Put another way, if a car dealer lies to you about the mileage of a car that you never would have purchased otherwise and the car breaks down, you would probably not be pleased with the car dealer for lying. When a company lies to investors about its financial condition, the result is not much different. The problem is further compounded when someone is trying to perform fundamental analysis to determine which stock to buy. The basic supposition of fundamental analysis is that the financial statements being evaluated are true and based upon facts. If the numbers themselves have been falsified, then it is impossible to ascertain the true financial condition of a company. In the cases of Enron, WorldCom, and a host of others, the numbers presented to the investing public were false, with disastrous consequences. The effect of such practices is twofold. First, we have all heard of the famous P/E (price to earnings) ratio. There are many such ratios that investors and analysts use to determine and predict a company's profitability. Each financial ratio requires true figures to be placed into the formula to reach the correct value. If the figures are false, then the ratio is skewed and the result is also false and misleading to the investor. The other negative effect of accounting fraud or false reporting is on the mindset of the investing public. The logic of the investing public says that if Enron or WorldCom, two corporate giants, lied about their financial condition, then how can any other company be trusted? The logical conclusion is to avoid the market altogether, because any company might be lying and investing would be too much like playing Russian roulette. There is no easy solution to this. Solid financial research can be the backbone of a good investment strategy. But with fundamental analysis being hampered by accounting deception, is there any other type of research we can use to choose stock? What about technical analysis? Is it useful when reliable corporate earning reports are absent? Yes, indeed.
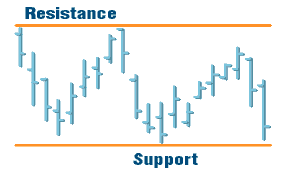
RESISTANCE AND SUPPORTThere are only two types of markets — bull markets and bear markets. The average stock will tend to trend downward in a bear market and upward in a bull market. Although there may be exceptions, this is how most stocks behave. Because stock prices in general have trended down in recent months, there is no doubt that we are currently in a bear market. Technical analysts look at trends in overall stock prices to determine future stock price movements. One crucial element that technical analysts look at is resistance and support levels (see Figure 1). The resistance level typically exists along the top of a trading range. This is a price level that the market or an individual stock tends to resist. Once the price of a stock has reached this resistance level, it may attempt to move down to hit the support level. As you can see from Figure 1, the support level represents an area that prices will resist going below. This is where bargain stock hunters will eventually jump in and start buying stocks that have fallen significantly in price. When this happens, other investors tend to follow suit and will begin to make more stock purchases, since they see stock prices going up. According to technical analysis, the market and individual stocks will then begin to trend up, creating a rise in the overall stock price.
Figure 1: Support and resistance levels. These areas can be significant when you are deciding to initiate positions.
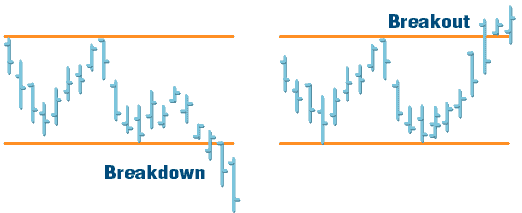
Although there are a number of factors that technical analysts use to predict stock price movement, once investors begin to snap up undervalued stocks on a relatively large scale, it is often seen as a positive sign. Technical analysts may also see this as indicating the beginning of a new upward trend. BREAKOUTSWhen a stock hits its resistance level and then rises above that level, it is known as a "bullish breakout" (Figure 2). Conversely, if a stock breaks through its support price to go even lower, it triggers a "bearish breakdown" (Figure 2). Either type of breakout is seen as indicating a significant trend. Therefore, if a stock's support level is at $10 per share and its price suddenly drops to $9 and then to $8 per share, a technical analyst will see this as an indication that the stock is trending downward again. The opposite is true for a bullish breakout.
Figure 2: Breakdowns and breakouts. When prices penetrate support levels, a breakdown occurs. When they go above resistance levels, it is considered a breakout.
The application of technical analysis is worth considering. It has many facets and provides an alternative to fundamental analysis, which has (as seen recently) been shaken by misleading accounting practices. Fundamental analysis may not be dead, not just yet. But with the current accounting scandals, the chartists may be having their heyday.
William M. Frantz teaches online investing for University of California San Diego Extension. He has written a book on online investing, Fell's Official Know-It-All Guide to Online Investing. For more information, visit www.21stcenturyonlineinvestortraining.info.
Current and past articles from Working Money, The Investors' Magazine, can be found at Working-Money.com.
|
PRINT THIS ARTICLE

Request Information From Our Sponsors
- StockCharts.com, Inc.
- Candle Patterns
- Candlestick Charting Explained
- Intermarket Technical Analysis
- John Murphy on Chart Analysis
- John Murphy's Chart Pattern Recognition
- John Murphy's Market Message
- MurphyExplainsMarketAnalysis-Intermarket Analysis
- MurphyExplainsMarketAnalysis-Visual Analysis
- StockCharts.com
- Technical Analysis of the Financial Markets
- The Visual Investor
- VectorVest, Inc.
- Executive Premier Workshop
- One-Day Options Course
- OptionsPro
- Retirement Income Workshop
- Sure-Fire Trading Systems (VectorVest, Inc.)
- Trading as a Business Workshop
- VectorVest 7 EOD
- VectorVest 7 RealTime/IntraDay
- VectorVest AutoTester
- VectorVest Educational Services
- VectorVest OnLine
- VectorVest Options Analyzer
- VectorVest ProGraphics v6.0
- VectorVest ProTrader 7
- VectorVest RealTime Derby Tool
- VectorVest Simulator
- VectorVest Variator
- VectorVest Watchdog


