HOT TOPICS LIST
- Strategies
- Stocks
- Buy
- Investing
- Brokers
- Psychology
- Interviews
- Accumulate
- Sell
- Hold
- Spotlight
- Websites
- Candlestick Corner
- Gold & Metals
- Options Trading
LIST OF TOPICS
FOCUS ON
Housing Construction Stocks
09/10/02 03:51:19 PM PSTby David Penn
Have home construction stocks overgrown their foundations?
| Rising home prices in the US have helped investors keep their minds off of their plummeting stock portfolios. But talk about a housing bubble has certainly replaced the Nasdaq in the sights of the doomsayers. Those naysayers point to discrepancies between the cost of homes and the growth of incomes (among other factors) when cautioning homeowners, prospective homebuyers, and those looking to buy property as an investment. They warn that the housing sector, which has buoyed the US economy since the stock market began crashing in 2000, may itself be on the verge of sinking. What is "sinking"? And how close to the verge are we? Few of the pro-housing bubble commentators are making specific predictions, no doubt chastened by those stock market bears who called market tops in 1995, and again in 1997, and again in 1998. Nevertheless, most of the housing market bears point to such factors as the precarious nature of subprime lending (lending to those with shaky or nonexistent credit histories), the mortgage refinancing boom driven by nominally low interest rates, and the prospect for outright deflation in the US economy, which would make debt more difficult for marginal borrowers — subprime or not — to repay. In addition, should deflation take hold of the US economy, the effects on the economy would be enough to depress most industry, including the homebuilding industry. But for technical analysts, there are more straightforward reasons to be wary of homebuilding stocks, some of which are up more than 100% since their autumn 2001 lows. The peaks that formed at the end of rallies in February and June 2002, for example, are looming as strong resistance to the late July and August 2002 advances of the homebuilding stocks. If the AugustSeptember advance fails to take out the February and June 2002 highs, it could be a long way back down for previously outperforming home construction stocks such as Lennar (LEN) and Toll Brothers (TOL), which are up 250% and 200%, respectively, since 2000. This, incidentally, includes the sharp late July 2002 correction, which saw these stocks lose significant portions of those gains (stocks like Pulte Homes [PHM], which were up 130% since 2000, lost as much as 32% off their 2002 peaks). WHAT IS A HOUSING BUBBLE? What makes the debate over a US housing bubble and bust interesting is that, unlike the Nasdaq bubble of 2000, most people have an idea of what a bubble looks like — both in the frothy, ecstatic boom and in the nausea-inducing, despair-stoking bust. The most obvious sign of a bubble is a rapid increase in prices for a given commodity (and I, like investment advisor commentator Marc Faber, tend to agree that eventually, all things become commodities). This price increase is all the more notable when the rise seems not to be attached to an upsurge in purchasing power. If home prices are increasing at one rate while median incomes are increasing at a slower one, some observers will begin to question how long home prices will increase if fewer people can afford to buy. These analysts will assert that what has made homebuilding attractive is less a demand for housing than more incentives to build homes. At the top of the list of these incentives are the historically low interest rates — beneficial to both homebuilders and homebuyers. With homes both cheaper to build and to buy because of low interest rates, it is little wonder that so much money has flowed into homebuilding over the past few years. Especially worrisome to these critics is the prevalence of 10% and less, "money-down" offers, leading some to wonder if the "zero-percent financing" that is quickly becoming a regular feature of automobile advertisements will begin to appear in ads from realtors. At the same time, however, those who do not believe a bubble is developing in the housing construction industry point to the fact that homes, unlike stocks, have a certain fundamental value: Regardless of whether a home appreciates in value, you can still live in it — unlike a stock portfolio. Renewed demand — in the wake of the "McMansion" phenomena of the late 1990s — from demographic changes in the United States are also pointed to as reasons the housing market may continue to thrive. (The Economist recently featured a cover story that underscored the burgeoning US population, due to immigration and what the article referred to as a "baby-boom echo," children born between 1977 and 1994 to baby boomers.) Regardless of what has caused housing prices to rise or remain stable in most areas of the US (even as the overall economy struggles), almost all observers are united on what could bring the "housing construction party" to a screeching halt: rising interest rates. Few dispute that, whether or not the housing industry is overextended, low interest rates have been the primary condition that made the continued growth of the homebuilding industry possible. And any signal that this primary condition might change — either because of increased signs of economic recovery or fears over inflation — could make for a swift and sudden reaction on the part of a homebuilding industry that has become accustomed to the sort of special powers that historically low interest rates can grant.
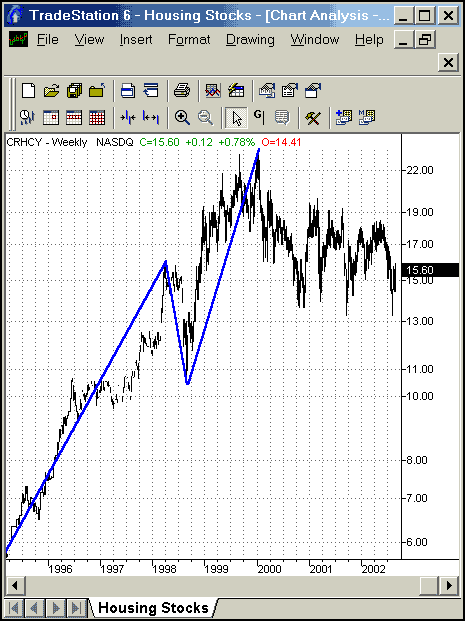
TOPPING HOUSING STOCKS?Lennar Corp., D.R. Horton (DHI), Centex (CTX), and Pulte Homes are four of the largest homebuilding companies by market capitalization (the largest is international construction firm CRH Public Ltd. Co.). Other homebuilding stocks to note include Wall Street darlings Toll Brothers (TOL) and KB Home (KBH). Note that all of these stocks — including CRH Public Ltd. — have moved closely together as they, as a group, put in bottoms in 1995 (see Figure 1).
Figure 1: Shares of homebuilder CRH Public Ltd. Co. enjoyed a sizable bull market from 1995 to 2000, appreciating some 260%. Also note how shares of CRH Public Ltd. rallied from the mid-1990s until reaching a peak in 1998, when it corrected sharply before rebounding to new highs at the end of 1999. While CRH Public has sold off some 32% from its peak in 2002, the bulk of CRHCY's bull market advance has remained intact, and the previous major low in mid-1998 is similarly unbroken. The price action since the break in late 1999 largely seems to be more of a trading range than a dedicated bear market. Compare CRHCY with the largest "domestic" homebuilding construction companies: Lennar, D.R. Horton, Centex (Figures 2 and 3).
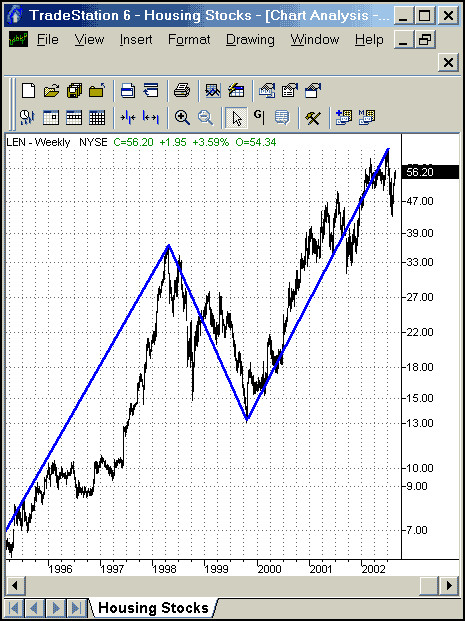
Figure 2: Most big homebuilders managed to extend their bull markets into 2000 and beyond, as this chart of Lennar Corp. suggests.
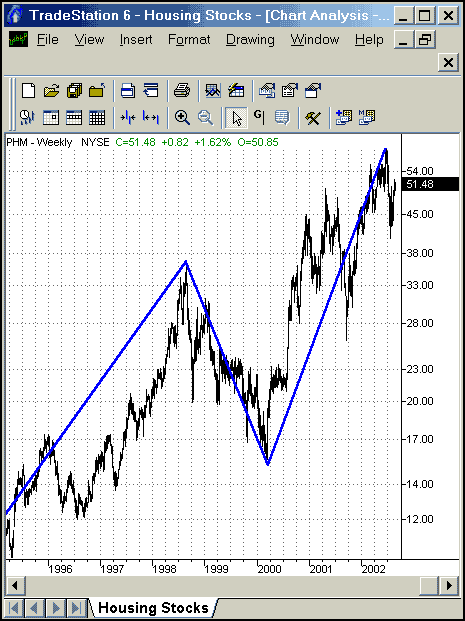
Figure 3: In the wake of the 2001 fall correction that dragged down the stock market, homebuilding stocks like Pulte Homes became part of the relief rally that lifted stocks across industries in late 2001 and into 2002.
The lines cast over the price action of these housing stocks highlight the two major bull markets these stocks have enjoyed since bottoming between the crash of 1987 and the recession of 199091. These two bull markets were in each case interrupted by a bear market that lasted from the spring of 1998 to the winter of 1999. These lines also match roughly the Elliott wave bull market cycle that posits (1) a rebound from a major bottom, (2) a test of the lows, (3) an initial bull market advance, (4) a major market correction, and (5) a final bull market advance to the peak. My goal is not so much to persuade others to adopt or include Elliott wave approaches in their own methodologies, but to underscore the clearly segmented price history of housing stocks since the late 1980s. Note how both Lennar and Pulte experienced significant corrections in the autumn of 2001 (unlike CRHCY). This, also observable on the stock charts of other US homebuilders, is likely due to the specific circumstance of the terrorist attacks in the United States in September 2001 (remember, CRHCY is an international concern). It is interesting to see these housing stocks appeared to be topping out by mid-2001, yet appeared to feel "new energy" in the wake of the autumn 2001 correction. This "new energy" was likely the Federal Reserve Board's decision to lower the Fed funds rate even further in September 2001, with the promise of an even more accommodative monetary policy if necessary. While all stocks enjoyed a major boost from this policy stance from the Fed, homebuilding stocks soared. From their September lows, stocks like D.R. Horton (DHI), Centex (CTX), and KB Home (KBH) literally doubled.
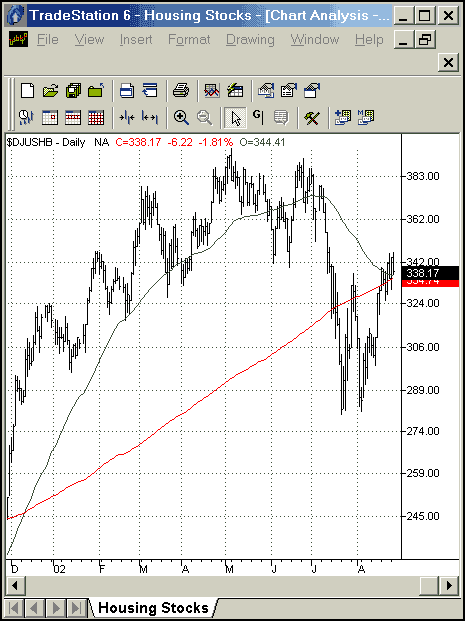
PROSPECTS FOR BREAKDOWNPutting the housing stocks late in a mature bull market advance probably betrays my suspicion that home construction stocks are due for a significant correction as a group. Nevertheless, there are a number of reasons to — at a minimum — develop some caution about the likelihood of continued advances in these stocks. The foremost among them from a technical perspective, perhaps, is the fact that homebuilding stocks have already appreciated a good amount in their secular bull market from about 198791 to the present (stocks like Centex bottomed in 1987; others like Lennar put in final bottoms in 1990). Although there have been some steep corrections, most notably in 1999, homebuilding stocks have rebounded at every turn. Two other charts highlight the challenges that home construction stocks are likely to face. Figure 4 is of the Dow Jones Home Construction Index, which shows home construction stocks having fallen beneath their 200-day moving average with the summer 2002 declines. Although this index has gained some ground on the 200-day moving average in August, the combination of the nearby long-term moving average and the correction lows from the spring of 2002 could prove resistant to the index's continued advance.
Figure 4: Home construction stocks topped in May 2002 and fell beneath their 200-day moving average in July.
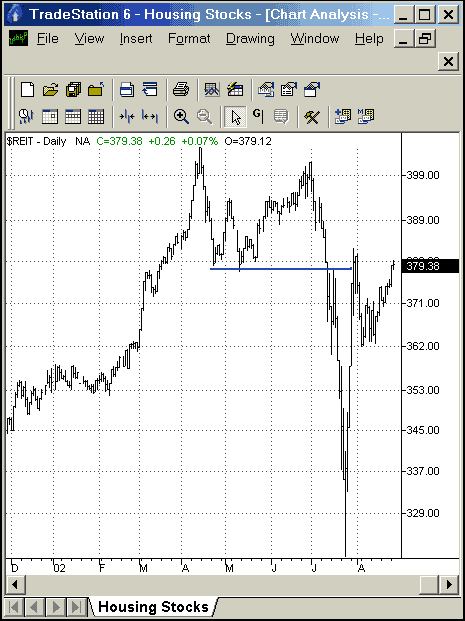
Figure 5, the other chart worth keeping in mind, is the Dow Jones Equity REIT Total Return Index, which focuses on real estate investment trusts. Here, what is notable as a failed test of top. Essentially, this means that REITs put in a top in early April 2002, corrected in May to form support, and then made another attempt at a new high in late June. This rally failed to put in a new high, which was bearish for the REIT sector. Sure enough, as the REIT index fell beneath the support area created by the spring 2002 correction lows, it continued falling, eventually losing over 20% in July before rebounding.
Figure 5: This failed "2B test of top" suggested that significant declines were in store for real estate investment trusts.
It is important to note the spring 2002 correction lows now serve as resistance to the post-July advance. As of late August, both the initial late-July advance and the mid-August advance have run into resistance at those correction lows from earlier in the year. If this resistance continues, then it is possible that real estate investment trusts will again experience selling pressure. None of this is bullish for home construction stocks, which are struggling to make new highs in the wake of the July 2002 selloff. While it is true that the performance of the housing sector in this still-sluggish economy has been remarkable since 2000, new highs in the homebuilding stocks in the near future — or in the real estate investment trusts, for that matter — would truly be even more astonishing.
David Penn may be reached at DPenn@Traders.com.
RELATED READINGThe Economist [2002]. "A Tale Of Two Bellies," August 24.TradeStation (TradeStation Technologies)
Current and past articles from Working Money, The Investors' Magazine, can be found at Working-Money.com.
|
Technical Writer for Technical Analysis of STOCKS & COMMODITIES magazine, Working-Money.com, and Traders.com Advantage.
| Title: | Traders.com Technical Writer |
| Company: | Technical Analysis, Inc. |
| Address: | 4757 California Avenue SW |
| Seattle, WA 98116 | |
| Phone # for sales: | 206 938 0570 |
| Fax: | 206 938 1307 |
| Website: | www.traders.com |
| E-mail address: | DPenn@traders.com |
Traders' Resource Links | |
| Charting the Stock Market: The Wyckoff Method -- Books | |
| Working-Money.com -- Online Trading Services | |
| Traders.com Advantage -- Online Trading Services | |
| Technical Analysis of Stocks & Commodities -- Publications and Newsletters | |
| Working Money, at Working-Money.com -- Publications and Newsletters | |
| Traders.com Advantage -- Publications and Newsletters | |
| Professional Traders Starter Kit -- Software | |
PRINT THIS ARTICLE

|

Request Information From Our Sponsors
- VectorVest, Inc.
- Executive Premier Workshop
- One-Day Options Course
- OptionsPro
- Retirement Income Workshop
- Sure-Fire Trading Systems (VectorVest, Inc.)
- Trading as a Business Workshop
- VectorVest 7 EOD
- VectorVest 7 RealTime/IntraDay
- VectorVest AutoTester
- VectorVest Educational Services
- VectorVest OnLine
- VectorVest Options Analyzer
- VectorVest ProGraphics v6.0
- VectorVest ProTrader 7
- VectorVest RealTime Derby Tool
- VectorVest Simulator
- VectorVest Variator
- VectorVest Watchdog
- StockCharts.com, Inc.
- Candle Patterns
- Candlestick Charting Explained
- Intermarket Technical Analysis
- John Murphy on Chart Analysis
- John Murphy's Chart Pattern Recognition
- John Murphy's Market Message
- MurphyExplainsMarketAnalysis-Intermarket Analysis
- MurphyExplainsMarketAnalysis-Visual Analysis
- StockCharts.com
- Technical Analysis of the Financial Markets
- The Visual Investor

