HOT TOPICS LIST
- Strategies
- Stocks
- Buy
- Investing
- Brokers
- Psychology
- Interviews
- Accumulate
- Sell
- Hold
- Spotlight
- Websites
- Candlestick Corner
- Gold & Metals
- Options Trading
LIST OF TOPICS
TRADER'S NOTEBOOK
Revisiting The 4% Solution
09/17/02 04:00:28 PM PSTby David Penn
How has the 4% model indicator performed since 2000?
| I've made no secret of my appreciation for the simplicity and robustness of the 4% model indicator, introduced by Martin Zweig in his Winning On Wall Street. Zweig tested the effectiveness of this always-in-the-market trend indicator on Value Line going back to the 1960s, comparing its performance versus a buy-and-hold investment approach. The relative outperformance of the 4% model indicator during this period was what impressed me the most. In both bearish and bullish markets of the 1970s and early 1980s, the 4% model indicator did well — a 16.4% annualized return from 1966 to 1985 versus a buy and hold annualized return of 2.4%. I extended Zweig's 4% model indicator from 1985 to 2000. I was curious whether the model — which performed well in the upward and downward trending markets between 1966 and 1985 — would also outperform a buy and hold strategy during the secular bull market from 1985 to 2000.
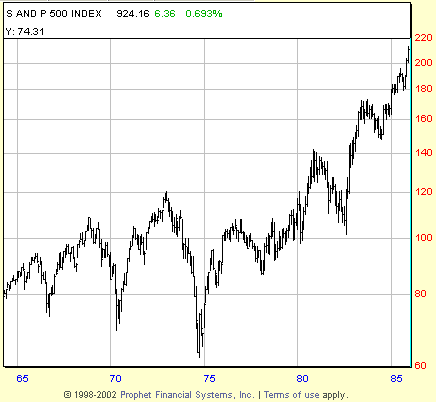
Figure 1: S&P 500 index. The trends of the secular bear market from 1966 to 1982 were a boon to traders.
Why did I think this was important? More than simply wanting to "update" the strategy, there were important differences between the stock markets of 196685 and 19852000. Even if a truly robust market model did not perform equally well in both periods, the model could at least keep the trader out of the market for much of the difficult periods. Conventional wisdom further suggests that even the best timing models have a hard time keeping up with the strong momentum of a raging bull market. As such, investors are better off putting their money in low-cost index funds, rather than sending their dollars to brokers whose stock selections will inevitably lag behind the overall market. Even those whose selections don't lag, goes the argument, will likely charge enough in management fees to make low-cost index funds still the better option for most investors. What I discovered was interesting. Using the Standard & Poor's 500, Dow Jones Industrial Average (Djia), and Nasdaq instead of Zweig's Value Line Composite Index, I found that the 4% model indicator from 1985 to 2000 mildly underperformed a buy and hold strategy with the S&P 500 and mildly outperformed a buy and hold strategy with the Djia. However, with the Nasdaq, the 4% model indicator truly excelled, besting a buy and hold strategy from 1985 to 2000 by nearly 3 to 1. As I first noted in my article "An Autumn Of Infamy," the 4% model indicator from December 1984 to August 2001 turned $10,000 into $50,000 when used against the S&P 500, compared to a buy and hold strategy that turned $10,000 into $72,000. But against the Nasdaq, the 4% model indicator turned $10,000 into $132,000, compared to a buy and hold approach that turned $10,000 into $73,000. I've since focused the 4% model indicator on the Nasdaq in general and the Nasdaq 100 in specific. In part, this was to be able to take advantage of the excellent trading vehicles — from the QQQ to options on the QQQ to e-mini Nasdaq 100 futures contracts — for the Nasdaq stocks. But clearly, the draw was the exceptional performance during the bull market period. The only question remaining — as the market topped in 2000 — was how well the 4% model indicator would perform on the way down.
4% MODEL AND THE BEAR MARKETOverall, the 4% model indicator performed well with the Nasdaq 100, or QQQ. Because the US equities markets are in bear markets, comparing the performance of the 4% model indicator to a buy and hold strategy is not especially helpful. (For the record, 100 shares of QQQ purchased at their peak in 2000 cost approximately $18,675. The same shares sold in August 2002 would be worth about $2,380. Suffice to say, the 4% model indicator has outperformed a buy and hold strategy in the Nasdaq 100.) Fortunately, the 4% model indicator with the QQQ has produced returns since 2000 that would make any investor proud. To restate the model, the 4% model indicator calls for buying the index on any increase of 4% or more in the weekly close, and selling the index on any decrease of 4% or more in the week-to-week close. If this Friday's close is more than 4% higher than last Friday's close, the 4% model indicator would call for buying the market. While there are "long-only" varieties of the indicator ("selling the index" as mentioned above becomes simply going to cash), the version used here is both long and short. In this case, a fixed 100-share block of QQQ was traded, which required $20,000 in purchasing power (cash or cash plus margin) when the study began in 2000. Each year begins with the first buy or sell signal. No carryover balances from previous years are included (save for the three-year cumulative return at the end). For the annual studies, the trade value at the end of the year is what is shown: no carryover trades from previous years.
2000
2001
2002 (as of August 30)
Cumulative Three-Year Return
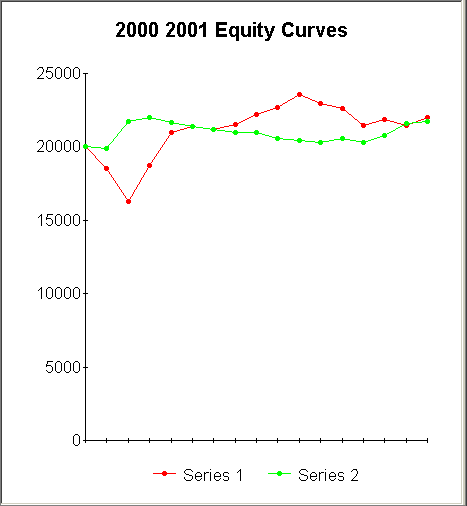
While there are a number of ways these trades could have been optimized (that is, by purchasing more shares as their price declined dramatically over the period), a fixed trading unit of 100 shares does not distract unduly from the performance of the 4% model indicator with the QQQ over the years since the market topped in 2000. Even the worst drawdown in 2000, a nail-biting 19%, was more than made up for by the relatively mild 2001 and 2002 years. A graphic representation of this through the annual equity curves only underscores the point.
Figure 2: Equity curves. Here, you see the 4% model indicator's performance against the QQQ in red (2000) and green (2001).
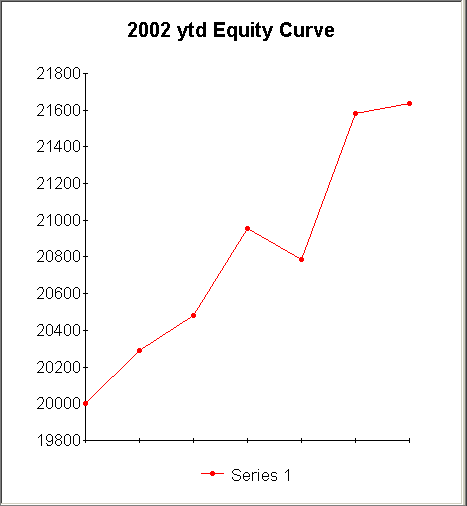
Figure 3: 2002 YTD equity curve. Here, you see the 4% model indicator's performance in 2002 against the QQQ, up to August 30.
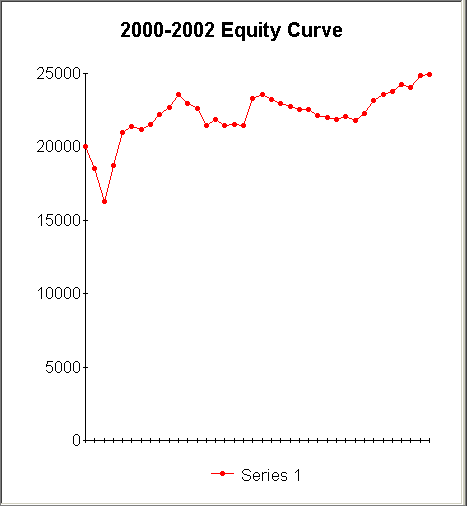
Figure 4: Three-year equity curve. The performance of the 4% model indicator against the QQQ from 2000 to August 30, 2002.
4% MODEL GOING FORWARDA 24.7% three-year return is an excellent return for investment purposes. Admittedly, 2002 has yet to end and the 4% model has in 2002 taken slightly more than half as many trades as in the previous two years, which hints at more volatility in the fall for the QQQ. But the outperformance of the 4% model from 1985 to 2000, combined with the model's performance (vis-à-vis the QQQ) in 2000, 2001, and 2002 to date is such that some confidence for the 4% model going forward is probably merited. I have spent little time updating the 4% model indicator's performance with the S&P 500 or the Dow industrials since 2000. Having only paid close attention to the 4% model indicator's performance against the S&P 500 and Dow industrials since the September 2001 lows, I can say that the performance of the indicator in these markets has been mixed. Trading the SPDR (the S&P 500 exchange-traded fund), the 4% model indicator was up modestly in 2002, while trading the DIA (known as diamonds, the Dow industrials exchange-traded fund) saw the 4% model more or less break even. I tend to use the 4% model indicator more as an indicator than as a trading strategy in and of itself. I find that keeping track of the 4% model indicator's read on the Nasdaq 100, S&P 500, and Dow industrials is a helpful way of determining how the market is moving, particularly when used with other indicators and models (wave counts, moving averages, trendlines, and so forth). Nonetheless, like many other indicators, it seems that the 4% model indicator — with the right markets — is a solid market timing tool in and of its own right.
David Penn may be reached at DPenn@Traders.com.
SUGGESTED READINGPenn, David [2001]. "An Autumn Of Infamy: The Ebbing Buy And Hold," Working Money Online, November 5.Zweig, Marty [ 1994]. Winning On Wall Street, Warner Books. Prophet Financial Systems; Yahoo! Finance (data)
Current and past articles from Working Money, The Investors' Magazine, can be found at Working-Money.com.
|
Technical Writer for Technical Analysis of STOCKS & COMMODITIES magazine, Working-Money.com, and Traders.com Advantage.
| Title: | Traders.com Technical Writer |
| Company: | Technical Analysis, Inc. |
| Address: | 4757 California Avenue SW |
| Seattle, WA 98116 | |
| Phone # for sales: | 206 938 0570 |
| Fax: | 206 938 1307 |
| Website: | www.traders.com |
| E-mail address: | DPenn@traders.com |
Traders' Resource Links | |
| Charting the Stock Market: The Wyckoff Method -- Books | |
| Working-Money.com -- Online Trading Services | |
| Traders.com Advantage -- Online Trading Services | |
| Technical Analysis of Stocks & Commodities -- Publications and Newsletters | |
| Working Money, at Working-Money.com -- Publications and Newsletters | |
| Traders.com Advantage -- Publications and Newsletters | |
| Professional Traders Starter Kit -- Software | |
PRINT THIS ARTICLE

|

Request Information From Our Sponsors
- StockCharts.com, Inc.
- Candle Patterns
- Candlestick Charting Explained
- Intermarket Technical Analysis
- John Murphy on Chart Analysis
- John Murphy's Chart Pattern Recognition
- John Murphy's Market Message
- MurphyExplainsMarketAnalysis-Intermarket Analysis
- MurphyExplainsMarketAnalysis-Visual Analysis
- StockCharts.com
- Technical Analysis of the Financial Markets
- The Visual Investor
- VectorVest, Inc.
- Executive Premier Workshop
- One-Day Options Course
- OptionsPro
- Retirement Income Workshop
- Sure-Fire Trading Systems (VectorVest, Inc.)
- Trading as a Business Workshop
- VectorVest 7 EOD
- VectorVest 7 RealTime/IntraDay
- VectorVest AutoTester
- VectorVest Educational Services
- VectorVest OnLine
- VectorVest Options Analyzer
- VectorVest ProGraphics v6.0
- VectorVest ProTrader 7
- VectorVest RealTime Derby Tool
- VectorVest Simulator
- VectorVest Variator
- VectorVest Watchdog


